() What type of graph is shown above? (H) Which variable is the explanatory variable? (iii) Give the equation of the simple linear regression model in the context of the analysis i.e not just using x and y. (Use 3 d.p. for the coefficients.)
() What type of graph is shown above? (H) Which variable is the explanatory variable? (iii) Give the equation of the simple linear regression model in the context of the analysis i.e not just using x and y. (Use 3 d.p. for the coefficients.)

Elementary Algebra
17th Edition
ISBN:9780998625713
Author:Lynn Marecek, MaryAnne Anthony-Smith
Publisher:Lynn Marecek, MaryAnne Anthony-Smith
Chapter10: Quadratic Equations
Section10.5: Graphing Quadratic Equations
Problem 212E: For the revenue model in Exercise 10.206 and Exercise 10.210, explain what the x-intercepts mean to...

Related questions
Question
100%
Please help me answer this question in detail
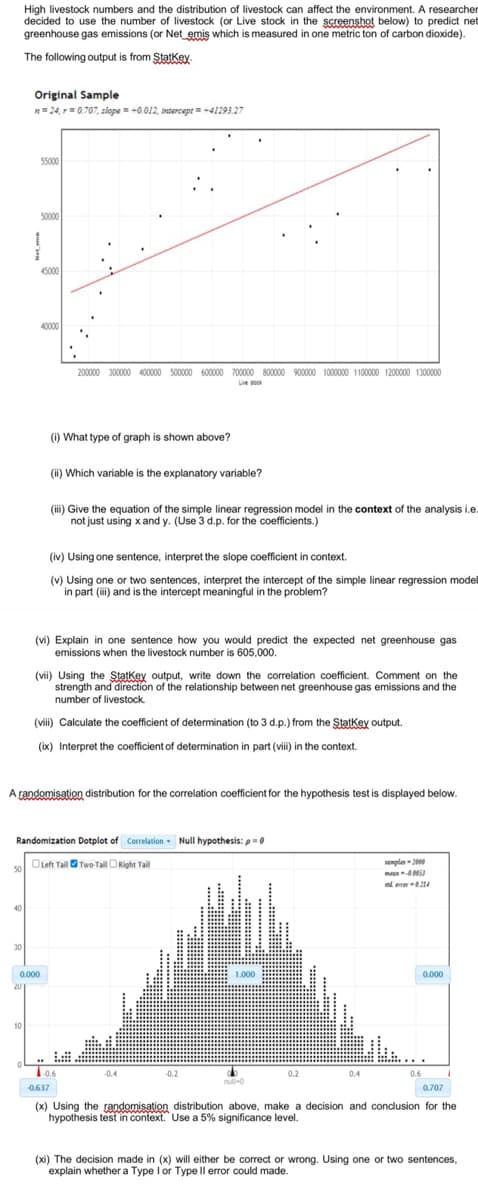
Transcribed Image Text:High livestock numbers and the distribution of livestock can affect the environment. A researcher
decided to use the number of livestock (or Live stock in the screenshot below) to predict net
greenhouse gas emissions (or Net emis which is measured in one metric ton of carbon dioxide).
The following output is from Statkey
Original Sample
R= 24, r=0.707, zlope = +0.012, intercept = +41293.27
55000
50000
45000
40000
200000 300000 400000 500000 600000 700000 800000 900000 1000000 1100000 1200000 1300000
Le sto
(i) What type of graph is shown above?
(ii) Which variable is the explanatory variable?
(i) Give the equation of the simple linear regression model in the context of the analysis i.e.
not just using x and y. (Use 3 d.p. for the coefficients.)
(iv) Using one sentence, interpret the slope coefficient in context.
(v) Using one or two sentences, interpret the intercept of the simple linear regression model
in part (i) and is the intercept meaningful in the problem?
(vi) Explain in one sentence how you would predict the expected net greenhouse gas
emissions when the livestock number is 605,000.
(vii) Using the Statkey output, write down the correlation coefficient. Comment on the
strength and direction of the relationship between net greenhouse gas emissions and the
number of livestock
(vii) Calculate the coefficient of determination (to 3 d.p.) from the Statkey output.
(ix) Interpret the coefficient of determination in part (viii) in the context.
A randomisation distribution for the correlation coefficient for the hypothesis test is displayed below.
Randomization Dotplot of Correlation Null hypothesis: p=0
so OLeft Tail Two-Tail ORight Tail
mple-2
t errer214
40
30
0.000
1.000
0.000
20
10
-0.6
-0.4
-0.2
0.2
0.4
0.6
null-0
0.637
0.707
(x) Using the randomisation distribution above, make a decision and conclusion for the
hypothesis test in context. Use a 5% significance level.
(xi) The decision made in (x) will either be correct or wrong. Using one or two sentences,
explain whether a Type I or Type ll error could made.
Expert Solution
This question has been solved!
Explore an expertly crafted, step-by-step solution for a thorough understanding of key concepts.

Step by step
Solved in 2 steps

Recommended textbooks for you
Elementary Algebra
Algebra
ISBN:
9780998625713
Author:
Lynn Marecek, MaryAnne Anthony-Smith
Publisher:
OpenStax - Rice University


Functions and Change: A Modeling Approach to Coll…
Algebra
ISBN:
9781337111348
Author:
Bruce Crauder, Benny Evans, Alan Noell
Publisher:
Cengage Learning
Elementary Algebra
Algebra
ISBN:
9780998625713
Author:
Lynn Marecek, MaryAnne Anthony-Smith
Publisher:
OpenStax - Rice University
Functions and Change: A Modeling Approach to Coll…
Algebra
ISBN:
9781337111348
Author:
Bruce Crauder, Benny Evans, Alan Noell
Publisher:
Cengage Learning