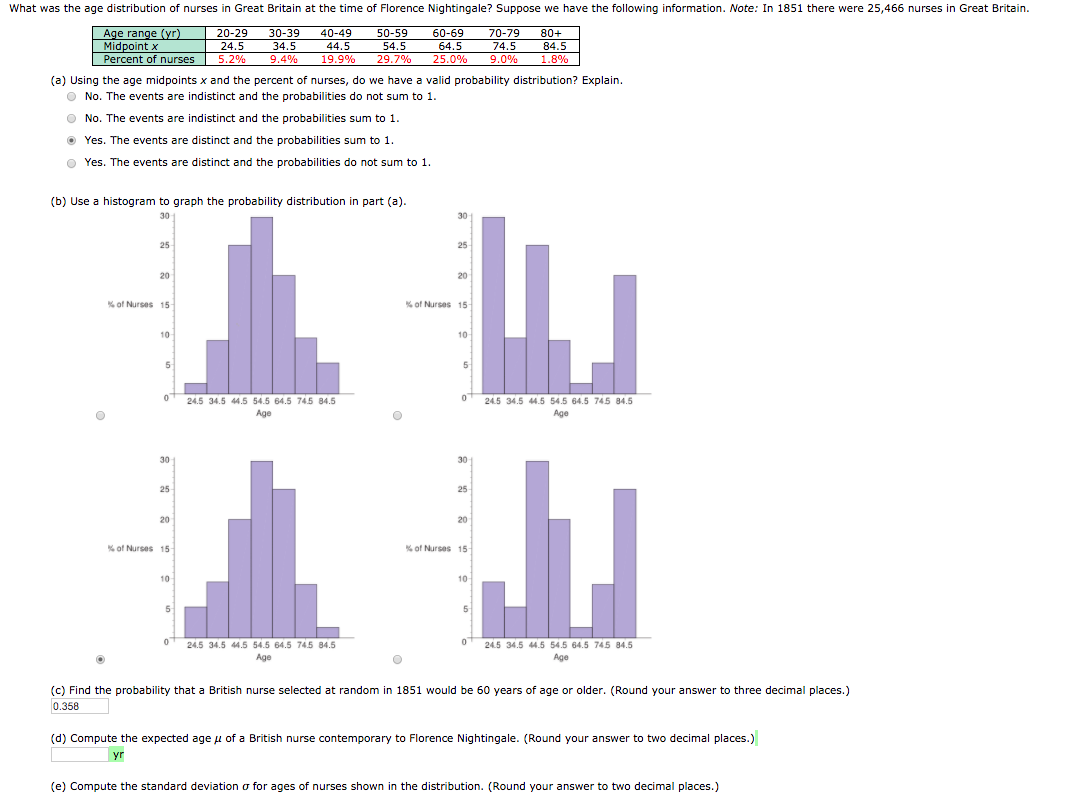
What was the age distribution of nurses in Great Britain at the time of Florence Nightingale? Suppose we have the following information. Note: In 1851 there were 25,466 nurses in Great Britain. 70-79 Age range (yr) Midpoint x Percent of nurses 20-29 30-39 40-49 44.5 50-59 54.5 60-69 80+ 84.5 1.8% 24.5 34.5 64.5 74.5 9.0% 5.2% 9.4% 19.9% 29.7% 25.0% (a) Using the age midpoints x and the percent of nurses, do we have a valid probability distribution? Explain. O No. The events are indistinct and the probabilities do not sum to 1. O No. The events are indistinct and the probabilities sum to 1. O Yes. The events are distinct and the probabilities sum to 1. O Yes. The events are distinct and the probabilities do not sum to 1. (b) Use a histogram to graph the probability distribution in part (a). 30 30 25 25 20 20 % of Nurses 15 % of Nurses 15 10 10 24.5 34.5 44.5 54.5 64.5 74.5 84.5 24.5 34.5 44.5 54.5 64.5 745 84.5 Age Age 30 30 25 25 20 20 % of Nurses 15 % of Nurses 15 10 10 24.5 34.5 44.5 54.5 64.5 74.5 84.5 24.5 34.5 44.5 54.5 64.5 745 84.5 Age Age (c) Find the probability that a British nurse selected at random in 1851 would be 60 years of age or older. (Round your answer to three decimal places.) 0.358 (d) Compute the expected age u of a British nurse contemporary to Florence Nightingale. (Round your answer to two decimal places.) yr (e) Compute the standard deviation o for ages of nurses shown in the distribution. (Round your answer to two decimal places.)
What was the age distribution of nurses in Great Britain at the time of Florence Nightingale? Suppose we have the following information. Note: In 1851 there were 25,466 nurses in Great Britain. 70-79 Age range (yr) Midpoint x Percent of nurses 20-29 30-39 40-49 44.5 50-59 54.5 60-69 80+ 84.5 1.8% 24.5 34.5 64.5 74.5 9.0% 5.2% 9.4% 19.9% 29.7% 25.0% (a) Using the age midpoints x and the percent of nurses, do we have a valid probability distribution? Explain. O No. The events are indistinct and the probabilities do not sum to 1. O No. The events are indistinct and the probabilities sum to 1. O Yes. The events are distinct and the probabilities sum to 1. O Yes. The events are distinct and the probabilities do not sum to 1. (b) Use a histogram to graph the probability distribution in part (a). 30 30 25 25 20 20 % of Nurses 15 % of Nurses 15 10 10 24.5 34.5 44.5 54.5 64.5 74.5 84.5 24.5 34.5 44.5 54.5 64.5 745 84.5 Age Age 30 30 25 25 20 20 % of Nurses 15 % of Nurses 15 10 10 24.5 34.5 44.5 54.5 64.5 74.5 84.5 24.5 34.5 44.5 54.5 64.5 745 84.5 Age Age (c) Find the probability that a British nurse selected at random in 1851 would be 60 years of age or older. (Round your answer to three decimal places.) 0.358 (d) Compute the expected age u of a British nurse contemporary to Florence Nightingale. (Round your answer to two decimal places.) yr (e) Compute the standard deviation o for ages of nurses shown in the distribution. (Round your answer to two decimal places.)

Glencoe Algebra 1, Student Edition, 9780079039897, 0079039898, 2018
18th Edition
ISBN:9780079039897
Author:Carter
Publisher:Carter
Chapter10: Statistics
Section10.6: Summarizing Categorical Data
Problem 4BGP

Related questions
Question
100%
Transcribed Image Text:What was the age distribution of nurses in Great Britain at the time of Florence Nightingale? Suppose we have the following information. Note: In 1851 there were 25,466 nurses in Great Britain.
70-79
Age range (yr)
Midpoint x
Percent of nurses
20-29
30-39
40-49
44.5
50-59
54.5
60-69
80+
84.5
1.8%
24.5
34.5
64.5
74.5
9.0%
5.2%
9.4%
19.9%
29.7%
25.0%
(a) Using the age midpoints x and the percent of nurses, do we have a valid probability distribution? Explain.
O No. The events are indistinct and the probabilities do not sum to 1.
O No. The events are indistinct and the probabilities sum to 1.
O Yes. The events are distinct and the probabilities sum to 1.
O Yes. The events are distinct and the probabilities do not sum to 1.
(b) Use a histogram to graph the probability distribution in part (a).
30
30
25
25
20
20
% of Nurses 15
% of Nurses 15
10
10
24.5 34.5 44.5 54.5 64.5 74.5 84.5
24.5 34.5 44.5 54.5 64.5 745 84.5
Age
Age
30
30
25
25
20
20
% of Nurses 15
% of Nurses 15
10
10
24.5 34.5 44.5 54.5 64.5 74.5 84.5
24.5 34.5 44.5 54.5 64.5 745 84.5
Age
Age
(c) Find the probability that a British nurse selected at random in 1851 would be 60 years of age or older. (Round your answer to three decimal places.)
0.358
(d) Compute the expected age u of a British nurse contemporary to Florence Nightingale. (Round your answer to two decimal places.)
yr
(e) Compute the standard deviation o for ages of nurses shown in the distribution. (Round your answer to two decimal places.)
Expert Solution
This question has been solved!
Explore an expertly crafted, step-by-step solution for a thorough understanding of key concepts.

This is a popular solution!

Trending now
This is a popular solution!

Step by step
Solved in 3 steps with 1 images

Recommended textbooks for you
Glencoe Algebra 1, Student Edition, 9780079039897…
Algebra
ISBN:
9780079039897
Author:
Carter
Publisher:
McGraw Hill
Glencoe Algebra 1, Student Edition, 9780079039897…
Algebra
ISBN:
9780079039897
Author:
Carter
Publisher:
McGraw Hill