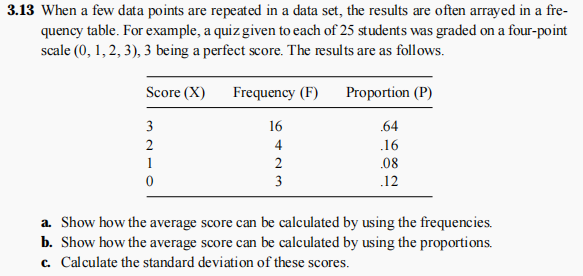
When a few data points are repeated in a data set, the results are often arrayed in a fre- quency table. For example, a quiz given to each of 25 students was graded on a four-point scale (0, 1, 2, 3), 3 being a perfect score. The results are as follows. Score (X) Frequency (F) Proportion (P) 3 16 .64 4 .16 1 2 .08 3 .12 a. Show how the average score can be calculated by using the frequencies. b. Show how the average score can be calculated by using the proportions. c. Calculate the standard deviation of these scores.
When a few data points are repeated in a data set, the results are often arrayed in a fre- quency table. For example, a quiz given to each of 25 students was graded on a four-point scale (0, 1, 2, 3), 3 being a perfect score. The results are as follows. Score (X) Frequency (F) Proportion (P) 3 16 .64 4 .16 1 2 .08 3 .12 a. Show how the average score can be calculated by using the frequencies. b. Show how the average score can be calculated by using the proportions. c. Calculate the standard deviation of these scores.

Glencoe Algebra 1, Student Edition, 9780079039897, 0079039898, 2018
18th Edition
ISBN:9780079039897
Author:Carter
Publisher:Carter
Chapter10: Statistics
Section10.6: Summarizing Categorical Data
Problem 4BGP

Related questions
Question
Transcribed Image Text:3.13 When a few data points are repeated in a data set, the results are often arrayed in a fre-
quency table. For example, a quiz given to each of 25 students was graded on a four-point
scale (0, 1, 2, 3), 3 being a perfect score. The results are as follows.
Score (X)
Frequency (F)
Proportion (P)
3
16
.64
2
4
.16
1
2
.08
3
.12
a. Show how the average score can be calculated by using the frequencies.
b. Show how the average score can be calculated by using the proportions.
c. Calculate the standard deviation of these scores.
Expert Solution
This question has been solved!
Explore an expertly crafted, step-by-step solution for a thorough understanding of key concepts.

This is a popular solution!

Trending now
This is a popular solution!

Step by step
Solved in 4 steps with 5 images

Recommended textbooks for you
Glencoe Algebra 1, Student Edition, 9780079039897…
Algebra
ISBN:
9780079039897
Author:
Carter
Publisher:
McGraw Hill
Glencoe Algebra 1, Student Edition, 9780079039897…
Algebra
ISBN:
9780079039897
Author:
Carter
Publisher:
McGraw Hill