When an audit must be conducted that involves a tedious examination of a large inventory, the audit may be very costly and time consuming if each item in the inventory must be examined. In such situations, the auditor frequently obtains a random sample of items from the complete inventory and uses the results of an audit of the sampled items to check the validity of the company's financial statement. A large company’s financial statement claims an inventory that averages $600 per item. The following data are the auditor’s assessment of a random sample of 75 items from the company’s inventory. The values resulting from the audit are rounded to the nearest dollar. Estimate the mean value of an item in the inventory using a 95% confidence interval. Is there substantial evidence (a 5 .01) that the mean value of an item in the inventory is less than $600? What is the target population for the above inferences?
When an audit must be conducted that involves a tedious examination of a large inventory, the audit may be very costly and time consuming if each item in the inventory must be examined. In such situations, the auditor frequently obtains a random sample of items from the complete inventory and uses the results of an audit of the sampled items to check the validity of the company's financial statement. A large company’s financial statement claims an inventory that averages $600 per item. The following data are the auditor’s assessment of a random sample of 75 items from the company’s inventory. The values resulting from the audit are rounded to the nearest dollar. Estimate the mean value of an item in the inventory using a 95% confidence interval. Is there substantial evidence (a 5 .01) that the mean value of an item in the inventory is less than $600? What is the target population for the above inferences?

Algebra & Trigonometry with Analytic Geometry
13th Edition
ISBN:9781133382119
Author:Swokowski
Publisher:Swokowski
Chapter10: Sequences, Series, And Probability
Section10.8: Probability
Problem 31E

Related questions
Topic Video
Question
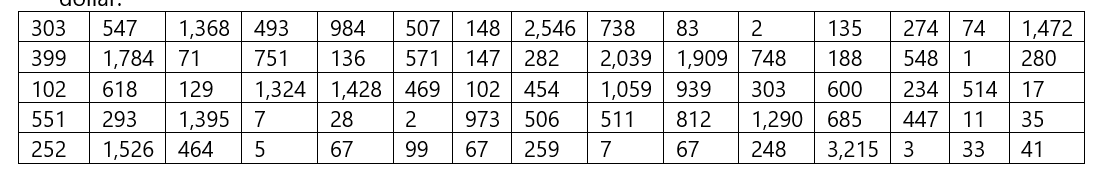
When an audit must be conducted that involves a tedious examination of a large inventory, the audit may be very costly and time consuming if each item in the inventory must be examined. In such situations, the auditor frequently obtains a random sample of items from the complete inventory and uses the results of an audit of the sampled items to check the validity of the company's financial statement. A large company’s financial statement claims an inventory that averages $600 per item. The following data are the auditor’s assessment of a random sample of 75 items from the company’s inventory. The values resulting from the audit are rounded to the nearest dollar.
- Estimate the
mean value of an item in the inventory using a 95% confidence interval. - Is there substantial evidence (a 5 .01) that the mean value of an item in the inventory is less than $600?
- What is the target population for the above inferences?
- Would
normal distribution –based procedures be appropriate for answering the above questions?
Transcribed Image Text:303
547
1,368
493
984
507
148 2,546
738
83
2
135
274
74
1,472
399
1,784 71
751
136
571
147
282
2,039
1,909
748
188
548
1
280
102
618
129
1,324 1,428 469
102 454
1,059
939
303
600
234
514
17
1,290 685
3,215 | 3
551
293
1,395
7
28
973
506
511
812
447
11
35
252
1,526
464
67
99
67
259
7
67
248
33
41
Expert Solution
This question has been solved!
Explore an expertly crafted, step-by-step solution for a thorough understanding of key concepts.

This is a popular solution!

Trending now
This is a popular solution!

Step by step
Solved in 2 steps

Knowledge Booster


Learn more about
Need a deep-dive on the concept behind this application? Look no further. Learn more about this topic, statistics and related others by exploring similar questions and additional content below.Recommended textbooks for you
Algebra & Trigonometry with Analytic Geometry
Algebra
ISBN:
9781133382119
Author:
Swokowski
Publisher:
Cengage


Holt Mcdougal Larson Pre-algebra: Student Edition…
Algebra
ISBN:
9780547587776
Author:
HOLT MCDOUGAL
Publisher:
HOLT MCDOUGAL
Algebra & Trigonometry with Analytic Geometry
Algebra
ISBN:
9781133382119
Author:
Swokowski
Publisher:
Cengage
Holt Mcdougal Larson Pre-algebra: Student Edition…
Algebra
ISBN:
9780547587776
Author:
HOLT MCDOUGAL
Publisher:
HOLT MCDOUGAL