
Database System Concepts
7th Edition
ISBN: 9780078022159
Author: Abraham Silberschatz Professor, Henry F. Korth, S. Sudarshan
Publisher: McGraw-Hill Education
expand_more
expand_more
format_list_bulleted
Related questions
Concept explainers
Question
python
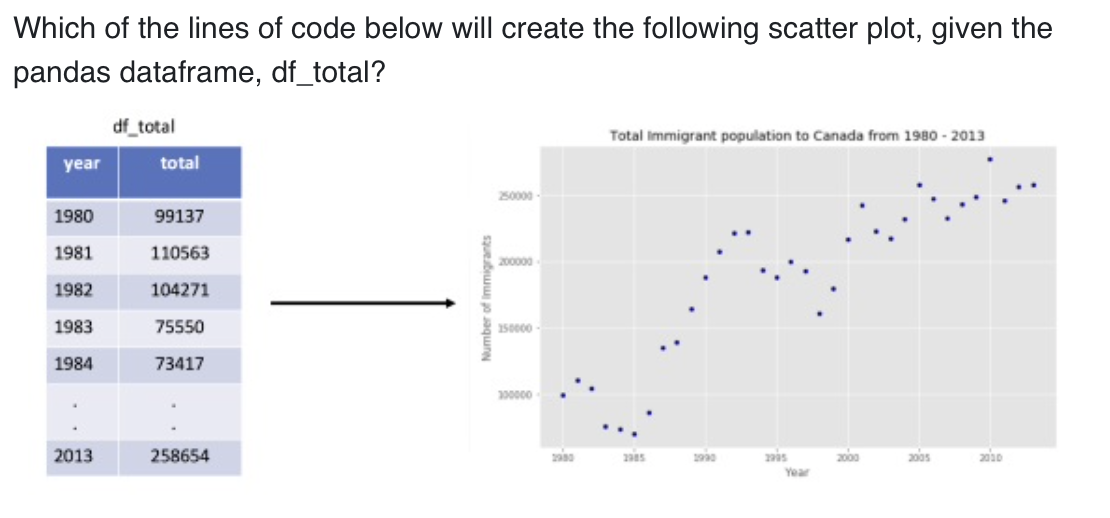

Transcribed Image Text:Which of the lines of code below will create the following scatter plot, given the
pandas dataframe, df_total?
year
1980
1981
1982
1983
1984
2013
df_total
total
99137
110563
104271
75550
73417
258654
Number of Immigrants
250000
200000
250000
300000
Total Immigrant population to Canada from 1980-2013
1990
2905
Year
2000
2005
2030

Transcribed Image Text:a.
b.
C.
d.
import matplotlib.pyplot as plt
df_total.plot(type='scatter',
x='year', y='total')
plt.title('Total Immigrant population to Canada from 1980 - 2013')
plt.label ('Year')
plt.label('Number of Immigrants')
import matplotlib.pyplot as plt
plot(kind='scatter', x='year', y='total', data=df_total)
plt.title('Total Immigrant population to Canada from 1980 - 2013')
plt.label ('Year')
plt.label('Number of Immigrants')
import matplotlib.pyplot as plt
df_total.plot(kind='scatter', x='year', y='total')
plt.title('Total Immigrant population to Canada from 1980 - 2013')
plt.xlabel ('Year')
plt.ylabel('Number of Immigrants')
import matplotlib.scripting.pyplot as plt
df_total.plot(kind='scatter', x='year', y='total')
plt.title('Total Immigrant population to Canada from 1980 - 2013')
plt.label('Year')
plt.label('Number of Immigrants')
Expert Solution
This question has been solved!
Explore an expertly crafted, step-by-step solution for a thorough understanding of key concepts.

This is a popular solution

Trending nowThis is a popular solution!

Step by stepSolved in 2 steps

Knowledge Booster


Learn more about
Need a deep-dive on the concept behind this application? Look no further. Learn more about this topic, computer-science and related others by exploring similar questions and additional content below.Similar questions
arrow_back_ios
SEE MORE QUESTIONS
arrow_forward_ios
Recommended textbooks for you
- Database System ConceptsComputer ScienceISBN:9780078022159Author:Abraham Silberschatz Professor, Henry F. Korth, S. SudarshanPublisher:McGraw-Hill Education
 Starting Out with Python (4th Edition)Computer ScienceISBN:9780134444321Author:Tony GaddisPublisher:PEARSON
 Digital Fundamentals (11th Edition)Computer ScienceISBN:9780132737968Author:Thomas L. FloydPublisher:PEARSON
  C How to Program (8th Edition)Computer ScienceISBN:9780133976892Author:Paul J. Deitel, Harvey DeitelPublisher:PEARSON
 Database Systems: Design, Implementation, & Manag...Computer ScienceISBN:9781337627900Author:Carlos Coronel, Steven MorrisPublisher:Cengage Learning
 Programmable Logic ControllersComputer ScienceISBN:9780073373843Author:Frank D. PetruzellaPublisher:McGraw-Hill Education
Database System Concepts
Computer Science
ISBN:9780078022159
Author:Abraham Silberschatz Professor, Henry F. Korth, S. Sudarshan
Publisher:McGraw-Hill Education
Starting Out with Python (4th Edition)
Computer Science
ISBN:9780134444321
Author:Tony Gaddis
Publisher:PEARSON
Digital Fundamentals (11th Edition)
Computer Science
ISBN:9780132737968
Author:Thomas L. Floyd
Publisher:PEARSON
C How to Program (8th Edition)
Computer Science
ISBN:9780133976892
Author:Paul J. Deitel, Harvey Deitel
Publisher:PEARSON
Database Systems: Design, Implementation, & Manag...
Computer Science
ISBN:9781337627900
Author:Carlos Coronel, Steven Morris
Publisher:Cengage Learning
Programmable Logic Controllers
Computer Science
ISBN:9780073373843
Author:Frank D. Petruzella
Publisher:McGraw-Hill Education