Y Y. Y (1) (2) (3) (4) 7. In the preceding figure, which graph depicts a technological breakthrough in the production of good X only? 8. In the preceding figure, which graph depicts a change in the PPF that is a likely consequence of war?
Y Y. Y (1) (2) (3) (4) 7. In the preceding figure, which graph depicts a technological breakthrough in the production of good X only? 8. In the preceding figure, which graph depicts a change in the PPF that is a likely consequence of war?

Chapter1: Making Economics Decisions
Section: Chapter Questions
Problem 1QTC

Related questions
Question
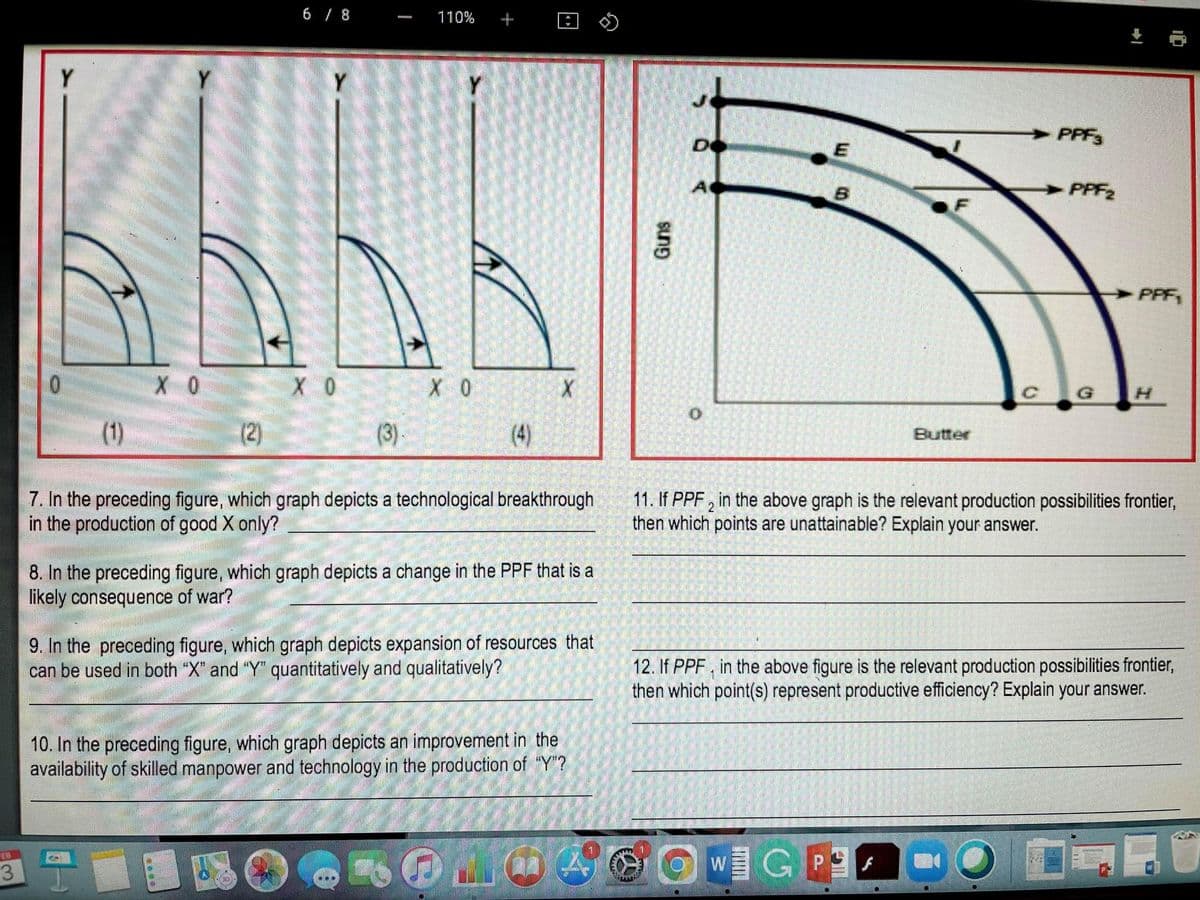
hello, can you please help me answering questions 8,10, and 12 in the image?
Transcribed Image Text:6 / 8
110%
+
Y
Y.
Y
Y
PPF3
De
PPF2
F
PPF
G
(1)
(2)
(3).
(4)
Butter
7. In the preceding figure, which graph depicts a technological breakthrough
in the production of good X only?
11. If PPF , in the above graph is the relevant production possibilities frontier,
then which points are unattainable? Explain your answer.
2
8. In the preceding figure, which graph depicts a change in the PPF that is a
likely consequence of war?
9. In the preceding figure, which graph depicts expansion of resources that
can be used in both "X" and "Y" quantitatively and qualitatively?
12. If PPF, in the above figure is the relevant production possibilities frontier,
then which point(s) represent productive efficiency? Explain your answer.
10. In the preceding figure, which graph depicts an improvement in the
availability of skilled manpower and technology in the production of “Y"?
WGP
EB
3
Guns
Expert Solution
This question has been solved!
Explore an expertly crafted, step-by-step solution for a thorough understanding of key concepts.

This is a popular solution!

Trending now
This is a popular solution!

Step by step
Solved in 2 steps

Knowledge Booster


Learn more about
Need a deep-dive on the concept behind this application? Look no further. Learn more about this topic, economics and related others by exploring similar questions and additional content below.Recommended textbooks for you

Principles of Economics (12th Edition)
Economics
ISBN:
9780134078779
Author:
Karl E. Case, Ray C. Fair, Sharon E. Oster
Publisher:
PEARSON

Engineering Economy (17th Edition)
Economics
ISBN:
9780134870069
Author:
William G. Sullivan, Elin M. Wicks, C. Patrick Koelling
Publisher:
PEARSON
Principles of Economics (12th Edition)
Economics
ISBN:
9780134078779
Author:
Karl E. Case, Ray C. Fair, Sharon E. Oster
Publisher:
PEARSON
Engineering Economy (17th Edition)
Economics
ISBN:
9780134870069
Author:
William G. Sullivan, Elin M. Wicks, C. Patrick Koelling
Publisher:
PEARSON

Principles of Economics (MindTap Course List)
Economics
ISBN:
9781305585126
Author:
N. Gregory Mankiw
Publisher:
Cengage Learning

Managerial Economics: A Problem Solving Approach
Economics
ISBN:
9781337106665
Author:
Luke M. Froeb, Brian T. McCann, Michael R. Ward, Mike Shor
Publisher:
Cengage Learning

Managerial Economics & Business Strategy (Mcgraw-…
Economics
ISBN:
9781259290619
Author:
Michael Baye, Jeff Prince
Publisher:
McGraw-Hill Education