YN CN Next question Suppose that the production function is given by 0 5VR N. where Y is output Kis capital and Nis the number of workers Suppose that &0.05 With your favorite spreadsheet software, compute steady-state output per worker and steady state consumption per worker for s 0 s01, 02. 35 Graph the steady-state level of output per worker and the steady-state level of consumption per worker as a function of the saving rate 25 24 1) Using the multipoint curve drawing tool, drawa curve showing the relationship between YIN and the saving rate. Properly label your curve 2) Using the multpoint curve drawing tool, draw a curve showing the relationship between CIN and the saving rate. Properly label your curve 15 05 Although the control ponts for your multipont curves do not have to be exact try to plot them as accurately as possible 6 01 02 03 04 Savn At what saving rates are YIN and CIN maximized? After plotting the final po press the Esc'key on yo YIN is maximized at a saving rate of O A. 0.5, and CIN is maximized at a saving rate of 1. OB. 1, and CIN is maximized at a saving rate of 1. OC. 05, and CIN is maximized at a saving rate of 0 5
YN CN Next question Suppose that the production function is given by 0 5VR N. where Y is output Kis capital and Nis the number of workers Suppose that &0.05 With your favorite spreadsheet software, compute steady-state output per worker and steady state consumption per worker for s 0 s01, 02. 35 Graph the steady-state level of output per worker and the steady-state level of consumption per worker as a function of the saving rate 25 24 1) Using the multipoint curve drawing tool, drawa curve showing the relationship between YIN and the saving rate. Properly label your curve 2) Using the multpoint curve drawing tool, draw a curve showing the relationship between CIN and the saving rate. Properly label your curve 15 05 Although the control ponts for your multipont curves do not have to be exact try to plot them as accurately as possible 6 01 02 03 04 Savn At what saving rates are YIN and CIN maximized? After plotting the final po press the Esc'key on yo YIN is maximized at a saving rate of O A. 0.5, and CIN is maximized at a saving rate of 1. OB. 1, and CIN is maximized at a saving rate of 1. OC. 05, and CIN is maximized at a saving rate of 0 5

Chapter1: Making Economics Decisions
Section: Chapter Questions
Problem 1QTC

Related questions
Question
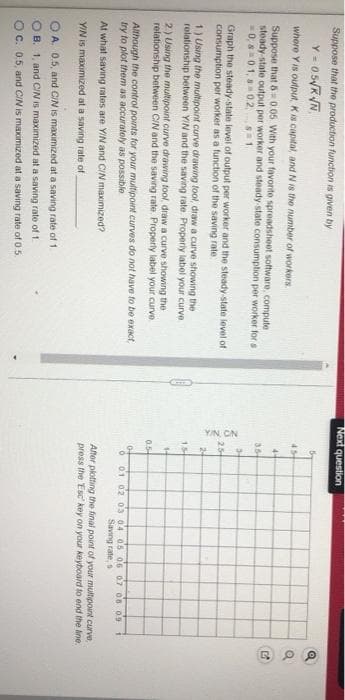
Transcribed Image Text:YIN CN
Next question
Suppose that the production function is given by
Y- 05VR N
454
where Y is output, Kis capital, and N is the number of workers
4
Suppose that 60 05 With your favonte spreadsheet software, compute
steady-state output per worker and steady-state consumption per worker for s
0, 801, a02, s1
Graph the steady-state level of output per worker and the steady-state level of
consumption per worker as a function of the saving rate
25
1) Using the multipoint curve drawing tool, drawa curve showing the
relationship between YIN and the saving rate. Properly label your curve
15
2) Using the multipoint curve drawing tool, draw a curve showing the
relationship between CIN and the saving rate. Properly label your curve
0.5
Although the control ponts for your multpownt curves do not have to be exact
try to plot them as accurately as possible
01 02 03 a'4 os o6 07 os 09
Saving rate,
At what saving rates are YIN and CIN maximized?
After plotting the final point of your multipoint curve
press the Esc' key on your keyboard to end the ine.
YIN is maximized at a saving rate of
O A. 0.5, and CIN is maximized at a saving rate of 1.
O B. 1, and C/IN is maximized at a saving rate of 1.
OC. 05, and CIN is maximized at a saving rate of 05.
Expert Solution
This question has been solved!
Explore an expertly crafted, step-by-step solution for a thorough understanding of key concepts.

This is a popular solution!

Trending now
This is a popular solution!

Step by step
Solved in 2 steps with 1 images

Knowledge Booster


Learn more about
Need a deep-dive on the concept behind this application? Look no further. Learn more about this topic, economics and related others by exploring similar questions and additional content below.Recommended textbooks for you

Principles of Economics (12th Edition)
Economics
ISBN:
9780134078779
Author:
Karl E. Case, Ray C. Fair, Sharon E. Oster
Publisher:
PEARSON

Engineering Economy (17th Edition)
Economics
ISBN:
9780134870069
Author:
William G. Sullivan, Elin M. Wicks, C. Patrick Koelling
Publisher:
PEARSON
Principles of Economics (12th Edition)
Economics
ISBN:
9780134078779
Author:
Karl E. Case, Ray C. Fair, Sharon E. Oster
Publisher:
PEARSON
Engineering Economy (17th Edition)
Economics
ISBN:
9780134870069
Author:
William G. Sullivan, Elin M. Wicks, C. Patrick Koelling
Publisher:
PEARSON

Principles of Economics (MindTap Course List)
Economics
ISBN:
9781305585126
Author:
N. Gregory Mankiw
Publisher:
Cengage Learning

Managerial Economics: A Problem Solving Approach
Economics
ISBN:
9781337106665
Author:
Luke M. Froeb, Brian T. McCann, Michael R. Ward, Mike Shor
Publisher:
Cengage Learning

Managerial Economics & Business Strategy (Mcgraw-…
Economics
ISBN:
9781259290619
Author:
Michael Baye, Jeff Prince
Publisher:
McGraw-Hill Education