You are conducting a test of homogeneity for the claim that two different populations have the same proportions of the following two characteristics. Here is the sample data. Population Population # 1 Category # 2 A 23 55 27 39
You are conducting a test of homogeneity for the claim that two different populations have the same proportions of the following two characteristics. Here is the sample data. Population Population # 1 Category # 2 A 23 55 27 39

MATLAB: An Introduction with Applications
6th Edition
ISBN:9781119256830
Author:Amos Gilat
Publisher:Amos Gilat
Chapter1: Starting With Matlab
Section: Chapter Questions
Problem 1P

Related questions
Topic Video
Question
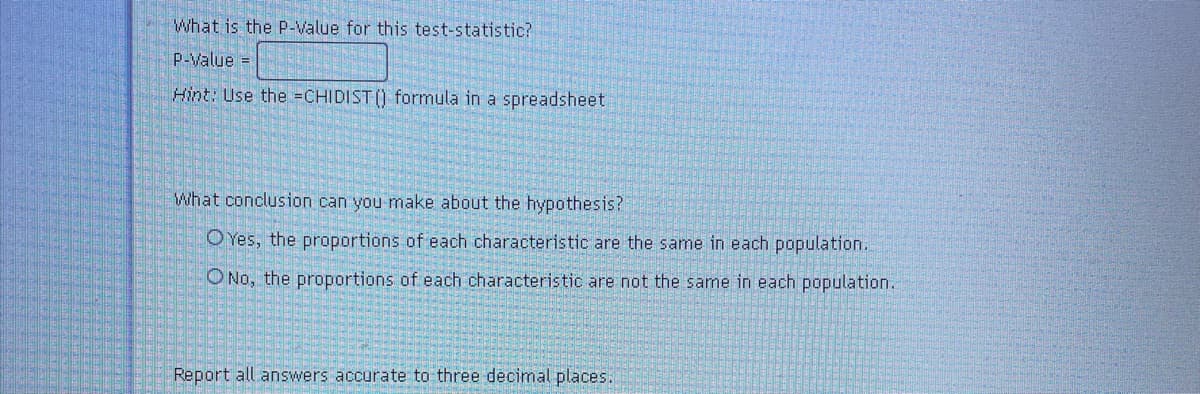
Transcribed Image Text:What is the P-Value for this test-statistic?
P-Value =
Hint: Use the =CHIDIST () formula in a spreadsheet
What conclusion can you make about the hypothesis?
O Yes, the proportions of each characteristic are the same in each population.
O No, the proportions of each characteristic are not the same in each population.
Report all answers accurate to three decimal places.
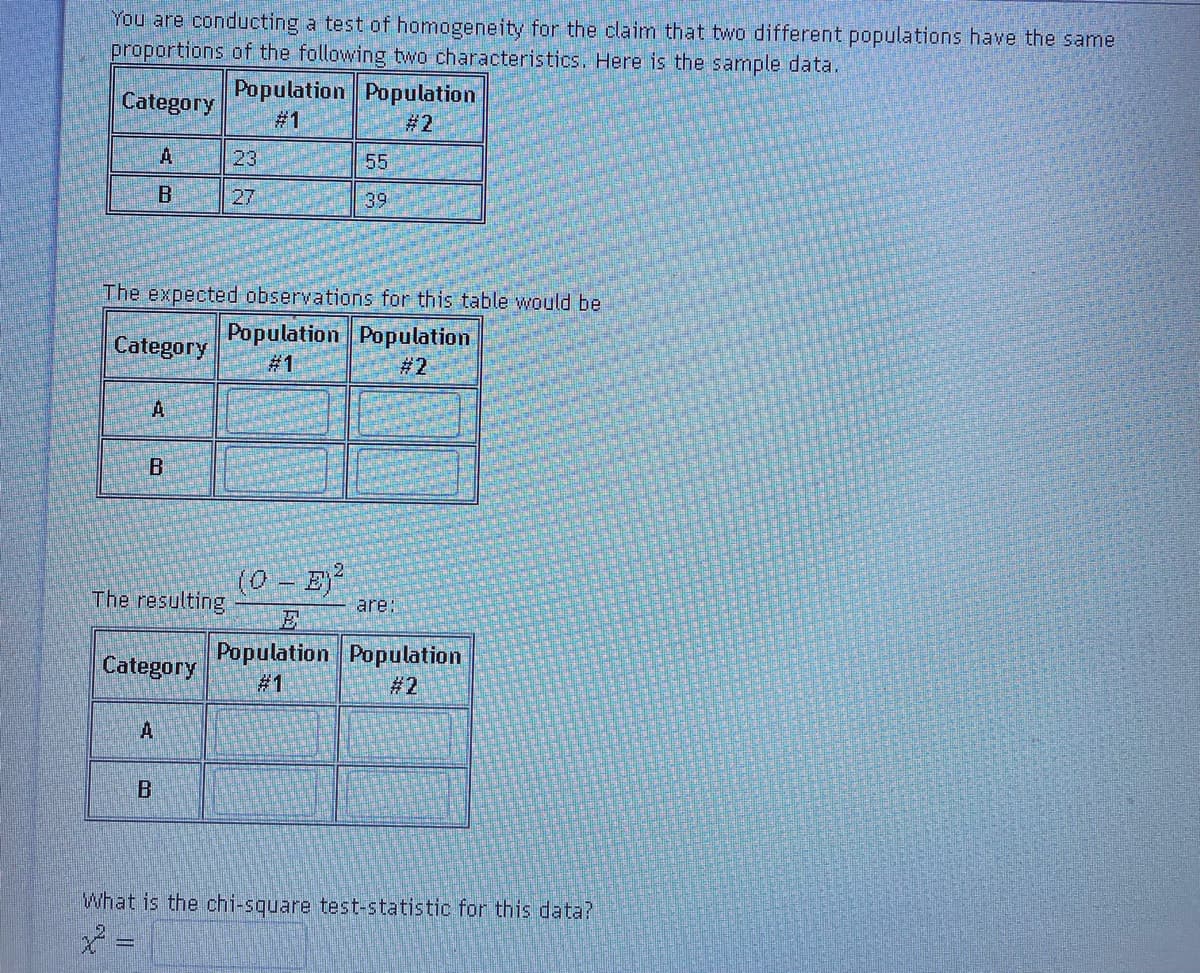
Transcribed Image Text:You are conducting a test of homogeneity for the claim that two different populations have the same
proportions of the following two characteristics. Here is the sample data.
Population Population
Category
# 1
ダ2
23
55
B
27
39
The expected observations for this table would be
Population Population
# 1
Category
# 2
A.
B
(0 - E)
The resulting
are:
Population Population
Category
# 1
# 2
A
What is the chi-square test-statistic for this data?
Expert Solution
This question has been solved!
Explore an expertly crafted, step-by-step solution for a thorough understanding of key concepts.

This is a popular solution!

Trending now
This is a popular solution!

Step by step
Solved in 2 steps

Knowledge Booster


Learn more about
Need a deep-dive on the concept behind this application? Look no further. Learn more about this topic, statistics and related others by exploring similar questions and additional content below.Recommended textbooks for you
MATLAB: An Introduction with Applications
Statistics
ISBN:
9781119256830
Author:
Amos Gilat
Publisher:
John Wiley & Sons Inc

Probability and Statistics for Engineering and th…
Statistics
ISBN:
9781305251809
Author:
Jay L. Devore
Publisher:
Cengage Learning

Statistics for The Behavioral Sciences (MindTap C…
Statistics
ISBN:
9781305504912
Author:
Frederick J Gravetter, Larry B. Wallnau
Publisher:
Cengage Learning
MATLAB: An Introduction with Applications
Statistics
ISBN:
9781119256830
Author:
Amos Gilat
Publisher:
John Wiley & Sons Inc
Probability and Statistics for Engineering and th…
Statistics
ISBN:
9781305251809
Author:
Jay L. Devore
Publisher:
Cengage Learning
Statistics for The Behavioral Sciences (MindTap C…
Statistics
ISBN:
9781305504912
Author:
Frederick J Gravetter, Larry B. Wallnau
Publisher:
Cengage Learning

Elementary Statistics: Picturing the World (7th E…
Statistics
ISBN:
9780134683416
Author:
Ron Larson, Betsy Farber
Publisher:
PEARSON

The Basic Practice of Statistics
Statistics
ISBN:
9781319042578
Author:
David S. Moore, William I. Notz, Michael A. Fligner
Publisher:
W. H. Freeman

Introduction to the Practice of Statistics
Statistics
ISBN:
9781319013387
Author:
David S. Moore, George P. McCabe, Bruce A. Craig
Publisher:
W. H. Freeman