
Database System Concepts
7th Edition
ISBN: 9780078022159
Author: Abraham Silberschatz Professor, Henry F. Korth, S. Sudarshan
Publisher: McGraw-Hill Education
expand_more
expand_more
format_list_bulleted
Related questions
Question
please draw the charts!! not just typed answer. Please explain how to do it as well for parts A,B,C,D
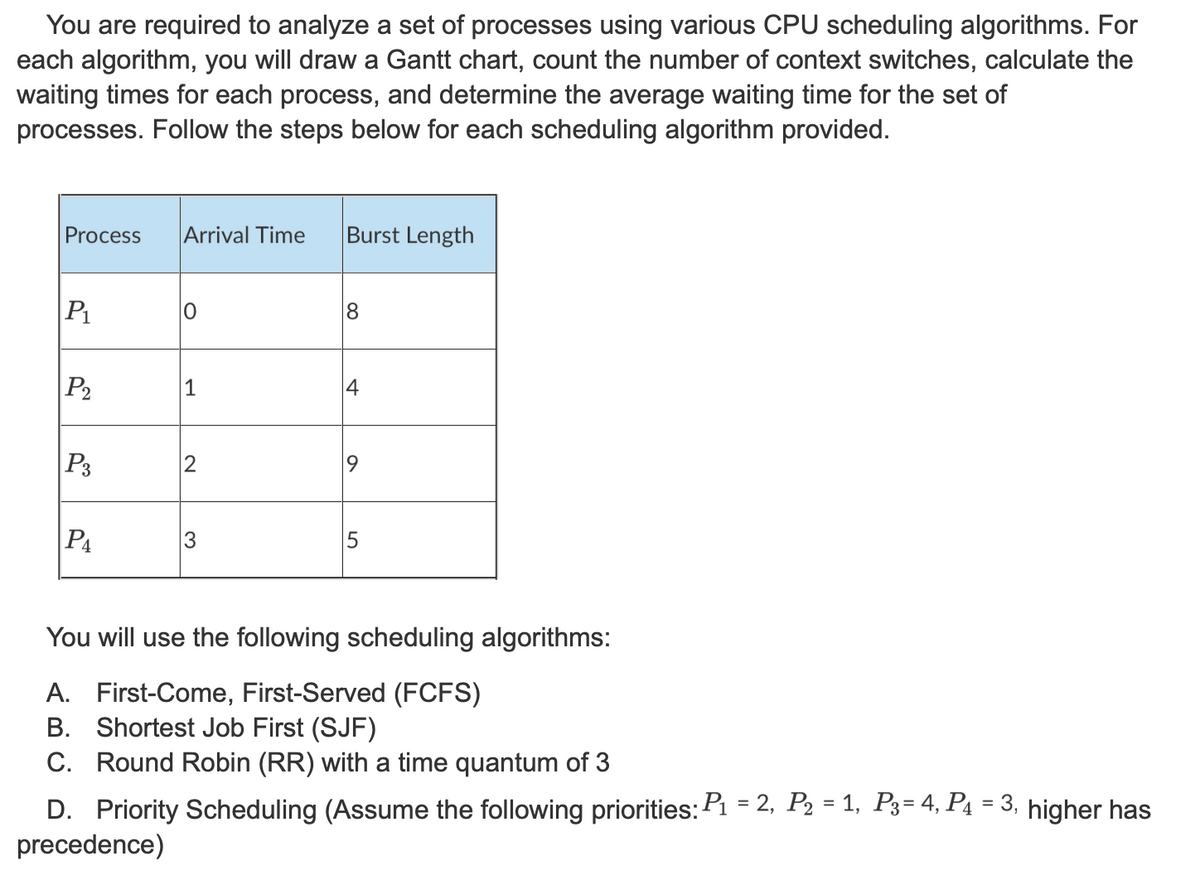

Transcribed Image Text:You are required to analyze a set of processes using various CPU scheduling algorithms. For
each algorithm, you will draw a Gantt chart, count the number of context switches, calculate the
waiting times for each process, and determine the average waiting time for the set of
processes. Follow the steps below for each scheduling algorithm provided.
Process Arrival Time Burst Length
P₁
0
P2
1
P3
2
P4
3
8
+
166
5
You will use the following scheduling algorithms:
A. First-Come, First-Served (FCFS)
B. Shortest Job First (SJF)
C. Round Robin (RR) with a time quantum of 3
D. Priority Scheduling (Assume the following priorities: P₁ = 2, P₂ = 1, P3= 4, P4 = 3, higher has
precedence)

Transcribed Image Text:For each scheduling algorithm listed above:|
Draw a Gantt chart showing the schedule for the processes (when they are running)
Count the number of context switches for each process.
Calculate the waiting time for each process.
Calculate the average waiting time for the set of processes.
NOTE: Make sure that your Gantt charts clearly show the start and stop times for each process.
Processes may stop and start multiple times before they finish. Show all calculations. Again note as
priorities increase, processes gain precedence. They will preempt lower priority processes.
Expert Solution
This question has been solved!
Explore an expertly crafted, step-by-step solution for a thorough understanding of key concepts.

Step by stepSolved in 2 steps

Knowledge Booster

Similar questions
- So, are these statements correct? It is impossible to display on a single map several layers (data) using different coordinate systems. For GIS purposes, it is allowed for data to include several coordinate systems. A map may display several different layers of data, each with its own set of coordinates. A map's layers may not align correctly if you use several coordinate systems to display them. Those things are not includedarrow_forwardPlease answer in python With showing the imagearrow_forwardFind the answer to the following subtraction problem by using the Left to Right Algorithm. Do the work on paper then upload a picture. Make sure your drawing is clear. 3131 - 1641arrow_forward
Recommended textbooks for you
- Database System ConceptsComputer ScienceISBN:9780078022159Author:Abraham Silberschatz Professor, Henry F. Korth, S. SudarshanPublisher:McGraw-Hill Education
 Starting Out with Python (4th Edition)Computer ScienceISBN:9780134444321Author:Tony GaddisPublisher:PEARSON
 Digital Fundamentals (11th Edition)Computer ScienceISBN:9780132737968Author:Thomas L. FloydPublisher:PEARSON
  C How to Program (8th Edition)Computer ScienceISBN:9780133976892Author:Paul J. Deitel, Harvey DeitelPublisher:PEARSON
 Database Systems: Design, Implementation, & Manag...Computer ScienceISBN:9781337627900Author:Carlos Coronel, Steven MorrisPublisher:Cengage Learning
 Programmable Logic ControllersComputer ScienceISBN:9780073373843Author:Frank D. PetruzellaPublisher:McGraw-Hill Education
Database System Concepts
Computer Science
ISBN:9780078022159
Author:Abraham Silberschatz Professor, Henry F. Korth, S. Sudarshan
Publisher:McGraw-Hill Education
Starting Out with Python (4th Edition)
Computer Science
ISBN:9780134444321
Author:Tony Gaddis
Publisher:PEARSON
Digital Fundamentals (11th Edition)
Computer Science
ISBN:9780132737968
Author:Thomas L. Floyd
Publisher:PEARSON
C How to Program (8th Edition)
Computer Science
ISBN:9780133976892
Author:Paul J. Deitel, Harvey Deitel
Publisher:PEARSON
Database Systems: Design, Implementation, & Manag...
Computer Science
ISBN:9781337627900
Author:Carlos Coronel, Steven Morris
Publisher:Cengage Learning
Programmable Logic Controllers
Computer Science
ISBN:9780073373843
Author:Frank D. Petruzella
Publisher:McGraw-Hill Education