You have the following data points which belong to a function of the form y = aeb, where b can be positive or negative. 4.13 3.26 2.57 0.100 0.200 0.300 You wish to determine the value of the constant, 6, and to do so you will construct a linear plot. What will you plot against what? y-axis label: Iny x-axis label: x From the values of a and y in the table above, calculate the values of the three corresponding data points. Click on the graph below, and use the "Freeform Curves" tool to plot the data. segments will automatically connect the points. Enter Solution What is the numerical value of the constant, 6? b = Submit Answer Retry Entire Group No more group attempts remain
You have the following data points which belong to a function of the form y = aeb, where b can be positive or negative. 4.13 3.26 2.57 0.100 0.200 0.300 You wish to determine the value of the constant, 6, and to do so you will construct a linear plot. What will you plot against what? y-axis label: Iny x-axis label: x From the values of a and y in the table above, calculate the values of the three corresponding data points. Click on the graph below, and use the "Freeform Curves" tool to plot the data. segments will automatically connect the points. Enter Solution What is the numerical value of the constant, 6? b = Submit Answer Retry Entire Group No more group attempts remain

Chemistry for Engineering Students
3rd Edition
ISBN:9781285199023
Author:Lawrence S. Brown, Tom Holme
Publisher:Lawrence S. Brown, Tom Holme
Chapter10: Entropy And The Second Law Of Thermodynamics
Section: Chapter Questions
Problem 10.17PAE

Related questions
Question
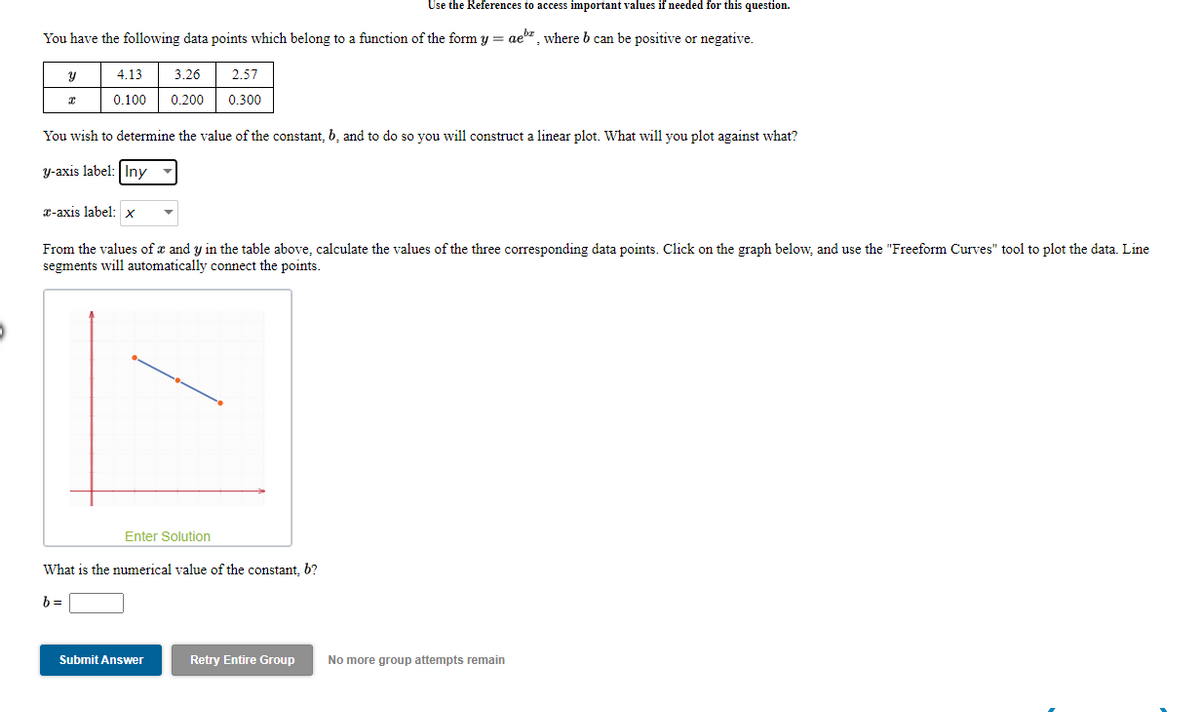
Transcribed Image Text:Use the References to access important values if needed for this question.
You have the following data points which belong to a function of the form y = ae", where b can be positive or negative.
4.13
3.26
2.57
0.100
0.200
0.300
You wish to determine the value of the constant, 6, and to do so you will construct a linear plot. What will you plot against what?
y-axis label: Iny -
x-axis label: x
From the values of a and y in the table above, calculate the values of the three corresponding data points. Click on the graph below, and use the "Freeform Curves" tool to plot the data. Line
segments will automatically connect the points.
Enter Solution
What is the numerical value of the constant, b?
b =
Submit Answer
Retry Entire Group
No more group attempts remain
Expert Solution
This question has been solved!
Explore an expertly crafted, step-by-step solution for a thorough understanding of key concepts.

Step by step
Solved in 2 steps with 1 images

Knowledge Booster


Learn more about
Need a deep-dive on the concept behind this application? Look no further. Learn more about this topic, chemistry and related others by exploring similar questions and additional content below.Recommended textbooks for you
Chemistry for Engineering Students
Chemistry
ISBN:
9781285199023
Author:
Lawrence S. Brown, Tom Holme
Publisher:
Cengage Learning

Physical Chemistry
Chemistry
ISBN:
9781133958437
Author:
Ball, David W. (david Warren), BAER, Tomas
Publisher:
Wadsworth Cengage Learning,

Chemistry for Engineering Students
Chemistry
ISBN:
9781285199023
Author:
Lawrence S. Brown, Tom Holme
Publisher:
Cengage Learning
Physical Chemistry
Chemistry
ISBN:
9781133958437
Author:
Ball, David W. (david Warren), BAER, Tomas
Publisher:
Wadsworth Cengage Learning,

Chemistry: Principles and Reactions
Chemistry
ISBN:
9781305079373
Author:
William L. Masterton, Cecile N. Hurley
Publisher:
Cengage Learning
