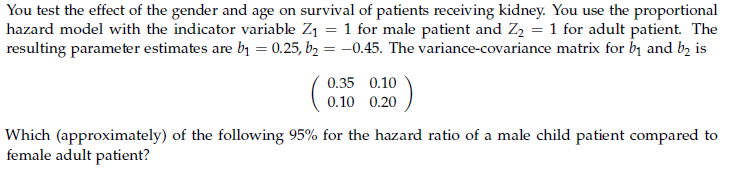
You test the effect of the gender and age on survival of patients receiving kidney. You use the proportional hazard model with the indicator variable Z1 = 1 for male patient and Z2 = 1 for adult patient. The resulting parameter estimates are b1 = 0.25, b2 = –0.45. The variance-covariance matrix for b1 and b, is 0.35 0.10 0.10 0.20


Q: 3. Does the equation describe a stationary process? If so, what is its expecta- tion? What is the…
A: Given: The given equation is Xt+0.5Xt-1=3+εt
Q: Suppose you have a Simple population regression function describe as follows Y₁ = Bo + B₁X₁ + εi…
A: Solution: From the given information, the regression equation with estimated coefficients is
Q: Consider the following regression model: Y₁ =B₁ + B₂X₂ + B3X31+ B4X41 + U1 Using the model above…
A:
Q: In regression with multiple input variables, which of the following can be a problem for finding…
A: Multiple regression analysis is also known as multiple linear regression (MLR) is a statistical…
Q: he following table gives information on the amount of sugar (in grams) and the calorie count in one…
A: Given data, X Y X*Y X*X 6 120 720 36 15 200 3000 225 12 150 1800 144 11 110 1210 121 8…
Q: Consider the following population regression model: Yi = Bo + B1D1i + B2Dzi + B3(D1¡D21) + uj,…
A: Given: the following population regression model: Y;= Bo + B1D1i +B2D2i+ B3(D1iP2i) + uj,, i = 1,…
Q: Find the variance with solution
A:
Q: A sample of n = 15 pairs of X and Y scores produces a Pearson correlation of r = 0.45, SSY = 90. a)…
A:
Q: The observations of yields (y) of a chemical reaction taken at various temperatures (x) were…
A: a) Correlation coefficient measures the strength and direction of the linear relationship between…
Q: 16. Which of the following is NOT a reason to code a QUANTITATIVE variable in a higher order…
A:
Q: Which of the following is not one of the statistical assumptions behind linear regression? a. The…
A: The assumptions of regression is given below: There is a linear relationship between dependent and…
Q: Consider the following econometric model birthweight = Bo+B₁smoking+u where birthweight is a baby's…
A: Consider the following econometric model birthweight = β0 + β1 smoking + u where birthweight is…
Q: In a simple linear regression model, B1 has important relationships with a sample correlation…
A: (1) To prove β^1=rSyySxx The general form of regression equation is Y=β0+β1X+ε By minimizing the…
Q: Suppose we run a multiple regression model with 3 predictors, and find the followir summary output…
A: From the given output, The estimate for the variable x1 is 3.5200 From the variance-covariance…
Q: on the basis of the value of linear correlation coefficient, would you conclude, at the /r/>0.9…
A: Correlation coefficient: It defines the linear relationship between 2 variables.
Q: Given the estimated least square regression line y=2.48+1.63x, and the coefficient of determination…
A:
Q: a. Develop a correlation matrix. Which independent variable has the strongest correla- tion with the…
A: a) Here, cars sales at last month is the depending variable(Y) and advertising (X1) and sales force…
Q: What is the coefficient of correlation for these data? -0.7839 0.8854 0.7839…
A: n = 6 small cities City price sales River City 1.36 100 Hudson 1.60 90 Ellsworth 1.80 90…
Q: In the least-squares regression model, y¡ = B1ס + Bo + &j, &¡ is a random error term with mean and…
A: Given that, Simple linear regression model, yi=β1xi+β0+εi
Q: In the packaging department of a large aircraft parts distributor, a fairly reliable estimate of…
A: (a) Least square regression equation: The least square regression equation is given below: y^=b0+b1x…
Q: Consider the regression model Y = B1 + B2X+ B3D+ BaX D+u, where D is a dummy variable. What would it…
A: Here use given model use for answer the question by putting value of beta4 equal to zero
Q: The following correlation matrix contains simple correlation coefficients between pairs of variables…
A: Given the correlation matrix contains simple correlation coefficients between pairs of variables…
Q: Consider the simple linear regression model Y = B1 + B2X + e, and let b2 be the estimate for B2 and…
A: P-value for two-tailed test: P-value (two-tailed test) = 2 × P-value (one-tailed test), where…
Q: Suppose that the index model for stocks A and B is estimated from excess returns with the following…
A:
Q: Which of the following is/are true if the coefficient of determination between the response and the…
A: The coefficient of determination between the response and predictor variable is 81% for a random…
Q: If all the points in a scatter diagram lie on the least squares regression line, what must be the…
A: Correlation coefficient describes about the relationship between two variables. If the coefficient…
Q: Consider the following table of data. 1 1 2 9 y 1 2 1 2 (a) Calculate the least squares line and the…
A: a)
Q: In a study of possible correlation between the height in cm (X) and the weight in kg (Y) of…
A: Given that, Let the height be independent variable (X) and weight be dependent variable (Y). The…
Q: Consider the simple linear model Y; = Bo + B1x; + €i, where e; is independent, identically…
A: Given that the linear regression equation is Yi=β0+β1xi+εi. Where, εi~iidN0, σ2. Also, provided that…
Q: 1. Consider the following regression model: Fram Risk Score; = Bo + B1 × Health Insurance; + ui The…
A: Given information: The regression model is given.
Q: A candy bar manufacturer is interested in trying to estimate how sales are influenced by the price…
A:
Q: Write the null hypothesis for testing the statistical significance of the interaction effect for the…
A: Given the regression model Y=β0+β1X1+β2D1+β3X1D1
Q: Prof. Reed is interested in studying the determinants of fertility. She believes that women who…
A: Here we want to determine how much the number of children a woman wants to have predicts her…
Q: he management of a supermarket wants to adopt a new promotional policy of giving free gift to every…
A: Hello. Since your question has multiple sub-parts, we will solve first three sub-parts for you. If…
Q: Derive the formulas for the variance of the MLE estimators of the unknown parameters of the simple…
A: Solution: It is needed to derive the formulas for the variance of the MLE estimators of the simple…
Q: question 1) Suppose that two measurements, d1, and d2, are uncorrelated and with equal variance, od.…
A: Consider the given values in the term of difference and addition and then proceed !!
Q: 6.In simple linear regression, the sample correlation coefficient between the input variable and the…
A: Answer : Option A
Q: In a study in pre-term infants, a group where breast feeding is difficult because the mother gets…
A: Given Information: The log odds for breast feeding for a 20 year old mom is given as:…
Q: Look at the following regression table where the dependent variable is the demand for illegal…
A: Introduction: The regression coefficient depends on the change of scale of the dependent, as well as…
Q: UNIVERSITY OF TOMORROW UNIVERSITY OF PETROLEUM & ENERGY STUDIES, DEHRADUN Department of Applied…
A: "Since you have asked multiple questions, we will solve the first question for you. If you want any…
Q: If all the points in a scatter diagram lie on the least squares regression line, then the…
A: Given that, All the points in a scatter diagram lie on the least squares regression line.
Q: The sample correlation coefficient is equal to the covariance of x and y divided by the square root…
A: It is an important part of statistics . It is widely used .
Q: Consider the following regression model: Weekly Hours = Bo + B1 × Wage + uį Weekly Hours is the…
A: Given information: The regression model is given.
Q: Past 10 years data on rainfall and per acre output of wheat in a certain village offered the…
A:
Q: The table below shows the data of x and ý for teh respor a) Draw the scatter diagram and draw the…
A: This question is based on regression analysis. Given data :
Q: The following table gives information on the amount of sugar (in grams) and the calorie count in one…
A: The data gives information on the amount of sugar (grams) and the calorie count in one serving of a…
Q: A random sample of non-industrialized countries was selected, and the life expectancy in years is…
A: Men,x 59.7 72.9 41.9 46.2 50.3 43.2 Men,y 63.8 77.8 44.5 48.3 54 43.5

Step by step
Solved in 2 steps


- 2. Given the following sets of information, find the linear least squares regression and the correlation coefficient.Suppose that the index model for two Canadian stocks HD and ML is estimated with the following results: RHD =-0.03+2.10RM+eHD R-squared =0.7 RML =0.06+1.60RM+eML R-squared =0.6 σM =0.15 where M is S&P/TSX Comp Index and RX is the excess return of stock X. What is the covariance and the correlation coefficient between HD and ML?In the packaging department of a large aircraft parts distributor, a fairly reliable estimate of packaging and processing costs can be determined by knowing the weight of an order. Thus, the weight is a cost driver that accounts for a sizable fraction of the packaging and processing costs at this company. Data for the past 10 orders are given as follows. Solve, a. Estimate the b0 and b1 coefficients, and determine the linear regression equation to fit these data. b. What is the correlation coefficient (R)? c. If an order weighs 250 lb, how much should it cost to package and process it?
- A candy bar manufacturer is interested in trying to estimate how sales are influenced by the price of their product. To do this, the company randomly chooses 6 small cities and offers the candy bar at different prices. Using candy bar sales as the dependent variable, the company will conduct a simple linear regression on the data below: City Price ($) Sales River City 1.30 100 Hudson 1.60 90 Ellsworth 1.80 90 Prescott 2.00 40 Rock Elm 2.40 38 Stillwater 2.90 32 What is the coefficient of correlation for these data? -0.7839 0.8854 0.7839 -0.8854During a 5-week period in 2007, the stock of an insurance company and the stock of a small tech company showed the following weekly percentage changes.Company Weekly Price Change (%)Insurance Stock 0.3 1.8 0 0. -1.5Tech Stock 0.3 -0.1 1.1 3.2 0.8 Find the variance of the weekly price changes of each. (Round your answers to four decimal places.) insurance stock= tech stock=The following matrix shows the bivariate correlations for houses with garages. Baths Beds Sqft Age Price Baths 1 Beds 0.591 1 Sqft 0.696 0.626 1 Age -0.427 -0.133 -0.069 1 Price 0.643 0.374 0.767 -0.099 1 Baths: # of bathrooms in the house Beds: # of bedrooms in the house Sqft: # of square feet in the house Age: age of the house in years Price: selling price of house Answer the following: a) Do older houses with garages sell for lower or higher prices than newer houses with garages on average? Are older houses with garages smaller or larger than newer houses with garages on average? b) Is the correlation between baths and age weaker or stronger than correlation between beds and price? c) Is the correlation between age and sqft weaker or stronger than the correlation between age and price?
- In the packaging department of a large aircraft parts distributor, a fairly reliable estimate of packaging and processing costs can be determined by knowing the weight of an order. Thus, the weight is a cost driver that accounts for a sizable fraction of the packaging and processing costs at this company. Data for the past 10 orders are given as follows: a. Estimate the b0 and b1 coefficients, and determine the linear regression equation to fit these data. b. What is the correlation coefficient (R)? c. If an order weighs 205 lb, how much should it cost to package and process it? Packaging and Processing Cost ($), y Weight (Pounds), x 99 240 111 275 86 210 85 185 121 315 114 300 111 285 100 270 109 275 85 200If a sample of 25 pairs of data yields a correlation coefficient, r, of 0.390 and the scatterplot displays a linear trend, can you use the regression equation to make predictions, assuming your x-values are within the domain of the data set? Choose your answer from the multiple choice answers below A.) Yes, because rcrit = 0.396 and the regression coefficient, r, is less than this value. B.) Yes, because rcrit = 0.381 and the regression coefficient, r, is greater than this value. C.) No, because rcrit = 0.381 and the regression coefficient, r, is greater than this value. D.) No, because rcrit = 0.396 and the regression coefficient, r, is less than this value.In a typical multiple linear regression model where x1 and x2 are non-random regressors, the expected value of the response variable y given x1 and x2 is denoted by E(y | 2,, X2). Build a multiple linear regression model for E (y | *,, *2) such that the value of E(y | x1, X2) may change as the value of x2 changes but the change in the value of E(y | X1, X2) may differ in the value of x1 . How can such a potential difference be tested and estimated statistically?