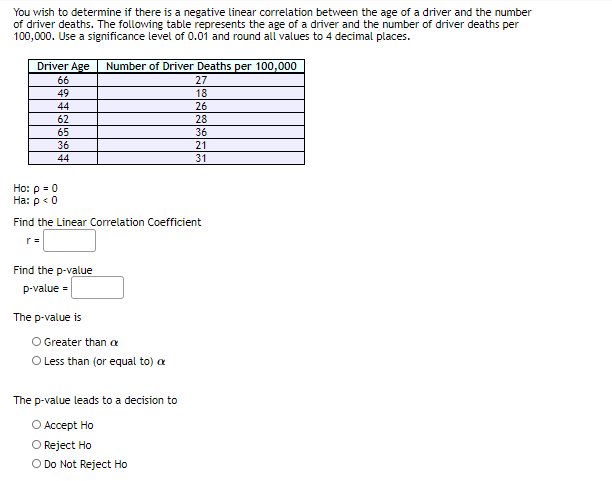
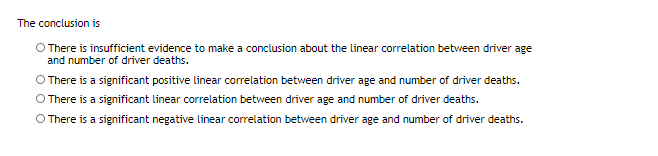
You wish to determine if there is a negative linear correlation between the age of a driver and the number of driver deaths. The following table represents the age of a driver and the number of driver deaths per 100,000. Use a significance level of 0.01 and round all values to 4 decimal places. Driver Age Number of Driver Deaths per 100,000 27 18 26 28 66 49 44 62 65 36 36 21 31 44 Ho: ρ0 На: р « 0 Find the Linear Correlation Coefficient Find the p-value p-value = The p-value is O Greater than a O Less than (or equal to) a The p-value leads to a decision to O Accept Ho O Reject Ho O Do Not Reject Ho


Inverse Normal Distribution
The method used for finding the corresponding z-critical value in a normal distribution using the known probability is said to be an inverse normal distribution. The inverse normal distribution is a continuous probability distribution with a family of two parameters.
Mean, Median, Mode
It is a descriptive summary of a data set. It can be defined by using some of the measures. The central tendencies do not provide information regarding individual data from the dataset. However, they give a summary of the data set. The central tendency or measure of central tendency is a central or typical value for a probability distribution.
Z-Scores
A z-score is a unit of measurement used in statistics to describe the position of a raw score in terms of its distance from the mean, measured with reference to standard deviation from the mean. Z-scores are useful in statistics because they allow comparison between two scores that belong to different normal distributions.

Step by step
Solved in 3 steps with 1 images


