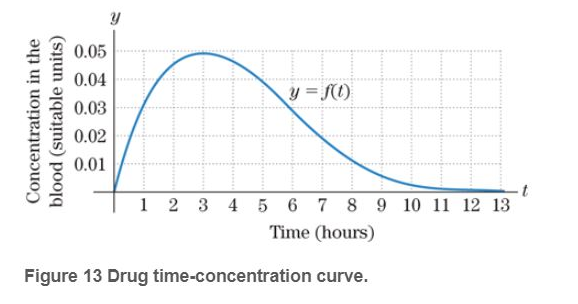
Exercises 43 − 46 relate to Fig. 13 . When a drug is injected into a person's muscle tissue, the concentration y of the drug in the blood is a function of the time elapsed since the injection. The graph of a typical time-concentration function f is given in Fig. 13 , where t = 0 corresponds to the time of the injection. At what time does f ( t ) attain its largest value?
Exercises 43 − 46 relate to Fig. 13 . When a drug is injected into a person's muscle tissue, the concentration y of the drug in the blood is a function of the time elapsed since the injection. The graph of a typical time-concentration function f is given in Fig. 13 , where t = 0 corresponds to the time of the injection. At what time does f ( t ) attain its largest value?
Solution Summary: The author explains that the function y=f(t) attains its largest value when the time t=3 hours.
Exercises
43
−
46
relate to Fig.
13
. When a drug is injected into a person's muscle tissue, the concentration
y
of the drug in the blood is a function of the time elapsed since the injection. The graph of a typical time-concentration function
f
is given in Fig.
13
, where
t
=
0
corresponds to the time of the injection.
At what time does
f
(
t
)
attain its largest value?
Need a deep-dive on the concept behind this application? Look no further. Learn more about this topic, calculus and related others by exploring similar questions and additional content below.
Discrete Distributions: Binomial, Poisson and Hypergeometric | Statistics for Data Science; Author: Dr. Bharatendra Rai;https://www.youtube.com/watch?v=lHhyy4JMigg;License: Standard Youtube License


 Linear Algebra: A Modern IntroductionAlgebraISBN:9781285463247Author:David PoolePublisher:Cengage Learning
 Glencoe Algebra 1, Student Edition, 9780079039897...AlgebraISBN:9780079039897Author:CarterPublisher:McGraw Hill
 Algebra & Trigonometry with Analytic GeometryAlgebraISBN:9781133382119Author:SwokowskiPublisher:Cengage
 Algebra: Structure And Method, Book 1AlgebraISBN:9780395977224Author:Richard G. Brown, Mary P. Dolciani, Robert H. Sorgenfrey, William L. ColePublisher:McDougal Littell