a.
To show: The data in tabular form in new worksheet.
Introduction: An investor may purchase stock of a company and become the stockholder (owner) of the company. Based on the performance of the company and demand for company’s stocks, the value of company’s stocks increases or decreases.
a.
Explanation of Solution
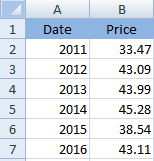
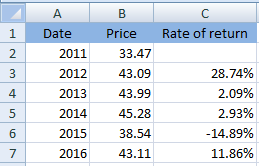
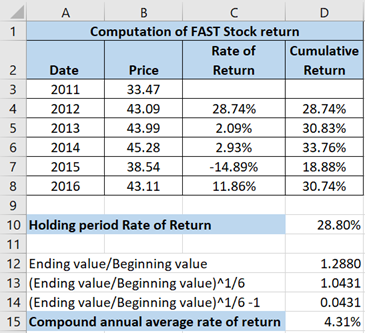
The date have been shown in ‘column A’ while price of stock has been represented in ‘column’ B. The tabular presentation of the given data has been shown below:
b.
To compute:
Introduction: An investor may purchase stock of a company and become the stockholder (owner) of the company. Based on the performance of the company and demand for company’s stocks, the value of company’s stocks increases or decreases.
b.
Explanation of Solution
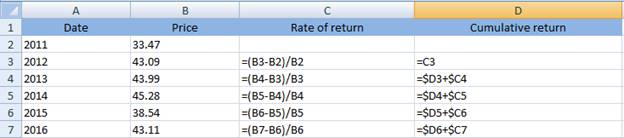
Rate of return for each year has been computed using the following formula:
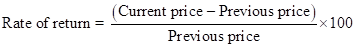
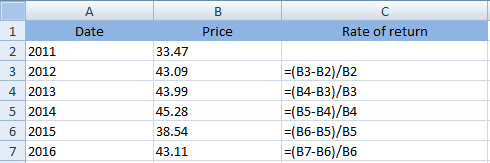
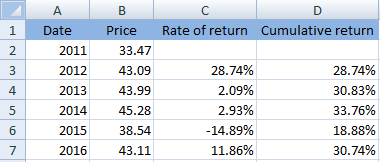
Thus, the calculated rate of return has been shown below:
c.
To compute: Cumulative total return since 2011.
Introduction: An investor may purchase stock of a company and become the stockholder (owner) of the company. Based on the performance of the company and demand for company’s stocks, the value of company’s stocks increases or decreases.
c.
Explanation of Solution
Cumulative rate of return can be computed by adding each year’s rate of return. It can be computed on excel using following formula:
Thus, the calculated cumulative rate of return has been shown below:
d.
To compute: Rate of return for holding period and compound average rate of return.
Introduction: An investor may purchase stock of a company and become the stockholder (owner) of the company. Based on the performance of the company and demand for company’s stocks, the value of company’s stocks increases or decreases.
d.
Explanation of Solution
The rate of return for the holding period can be computed as:

The calculated answer has been shown below:
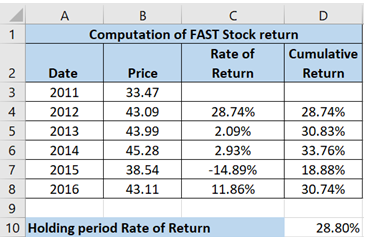
Now, compound annual average of return can be computed using:

e.
To prepare: Line chart and scattered chart. Also, state the difference between the two charts and suggest the most suitable.
Introduction: An investor may purchase stock of a company and become the stockholder (owner) of the company. Based on the performance of the company and demand for company’s stocks, the value of company’s stocks increases or decreases.
e.
Explanation of Solution
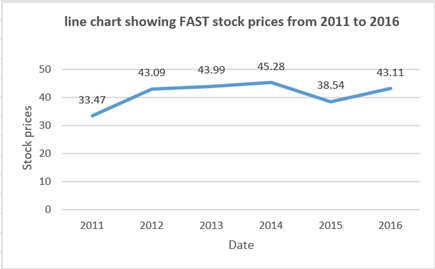
The line chart has been prepared for FAST stock prices:
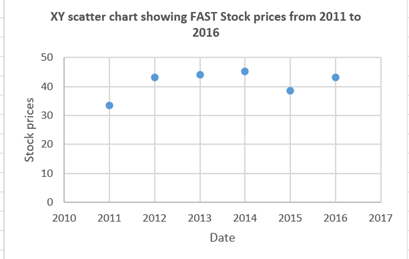
The scattered chart has been prepared for FAST stock prices:
Following are the differences between line and scatter chart:
Line chart: The values ??are plotted only on the y-axis i.e., the vertical axis. While, on the x-axis i.e., the horizontal axis the sequence number of the value is shown. Exceptions: graphs with the date on the X-axis.
Scatter chart: The relationship between two values is represented using the scatter chart. Scatter charts is often known as XY chart.
Here, two different values are not given which means there is no need to find the relationship between two values. So, in order to find trend of stock prices a line chart is more appropriate.
f.
To prepare: 3-D line chart and discuss if it helps in better understanding.
Introduction: An investor may purchase stock of a company and become the stockholder (owner) of the company. Based on the performance of the company and demand for company’s stocks, the value of company’s stocks increases or decreases.
f.
Explanation of Solution
The line chart has been prepared for FAST stock prices:

The 3-D line chart has been prepared:
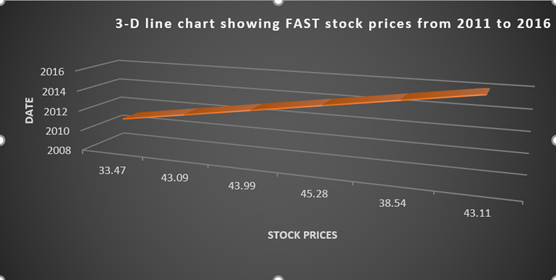
The comparison between the two charts can be seen easily. Thus, yes the enhancements will make data more attractive for the reader.
Want to see more full solutions like this?
Chapter 1 Solutions
EBK FINANCIAL ANALYSIS WITH MICROSOFT E

- Explain how a financial market operates? Which of the investment constraints is expected to have the most impact on your decision process? You plan to buy common stock and hold it for one year. You expect to receive both ₱150 and ₱260 from the sale of the stock at the end of the year. How much will you pay for the stock, if you want to a. Have a return of 8% b. A return of 20% c. A return of 15%arrow_forwardUsing Finance.Yahoo.com, draw a graph of your firm’s stock price movement in the past three years. Has the stock appreciated or depreciated? What is the stock’s highest and lowest price (adjusted for any stock splits) during the past three years? Does your stock pay dividends? If so, how has it changed during that period? I would like to use UnitedHealth Care Group as the company.arrow_forwardIf you look at stock prices over any year, you will find a high and low stock price for the year. Instead of a single benchmark PE ratio, we now have a high and low PE ratio for each year. We can use these ratios to calculate a high and a low stock price for the next year. Suppose we have the following information on a particular company over the past four years: Year 1 Year 2 Year 3 Year 4 High price $ 99.70 $ 123.30 $ 132.70 $ 149.33 Low price 74.53 90.64 71.32 117.85 EPS 8.98 10.73 11.81 13.20 Earnings are projected to grow at 9 percent over the next year. a. What is your high target stock price over the next year? (Do not round intermediate calculations and round your answer to 2 decimal places, e.g., 32.16.) b. What is your low target stock price over the next year? (Do not round intermediate calculations and round your answer to 2 decimal places, e.g., 32.16.)arrow_forward
- The attached file contains hypothetical data for working this problem. Goodman Corporation’s and Landry Incorporated’s stock prices and dividends, along with the Market Index, are shown in the file. Stock prices are reported for December 31 of each year, and dividends reflect those paid during the year. The market data are adjusted to include dividends. Use the data given to calculate annual returns for Goodman, Landry, and the Market Index, and then calculate average returns over the five-year period. (Hint: Remember, returns are calculated by subtracting the beginning price from the ending price to get the capital gain or loss, adding the dividend to the capital gain or loss, and dividing the result by the beginning price. Assume that dividends are already included in the index. Also, you cannot calculate the rate of return for 2015 because you do not have 2014 data.)arrow_forwardAs a broker at Churnem & Burnem Securities, you recommend stocks to your clients. After gathering data on Furniture Factory, you have found that its dividend has been growing at a rate of 4% per year to the current (Do) $1.35 per share. The stock is now selling for $24.50 per share, and you believe that an appropriate rate of return for this stock is 11% year. If you expect that the dividend will continue to grow at a 4% rate into the foreseeable future, what is the highest price at which you would recommend purchasing this stock to your clients? Suppose now that you believe that the company’s new product line will cause much higher growth in the near future. Your new estimate is for a three-year period of 9% annual growth to be followed by a return to the historical 4% growth rate. Under these new assumptions, what is the value using the two-stage dividend growth model? You now realize that it is likely that the growth will transition from 9% down to 4% gradually, rather than…arrow_forwardYou are evaluating the purchase of Bell, Inc. common stock that just paid a dividend of $4.60. You expect the dividend to grow at a rate of 10% for the next four years. You plan to hold the stock for four years and then sell it. You estimate the price of the company’s stock to rise to $59.37 at the end of your four-year holding period. A required rate of return of 13% will be adequate compensation for this investment. Given your assumptions, what is the current value of Bell stock? Round to the nearest $0.01 (allow a couple of pennies of rounding). answer is 53.62arrow_forward
- During the last four years, you owned two stocks that have had the following annual rates of return. Year KEX KW 2014 0.13 -0.08 2015 0.05 0.21 2016 0.07 0.06 2017 0.09 0.15 Compute the arithmetic mean annual return for EACH stock Compute the standard deviation of the annual rate of return for EACH stock Taking the results of (i) and (ii) into consideration, which stock is preferable? Why? Compute the geometric mean annual return for EACH stockarrow_forwardAs an analyst at Chitalu & Daka Securities, you are responsible for making recommendations to your firm’s clients regarding common stocks. After gathering data, you have found that their dividends have been growing at a rate of 10% per year to the current (D0) rate of K0.60 per share. The stock is currently selling for K12 per share, and you believe that an appropriate rate of return for this stock is 15% per year.i. If you expect that the dividend will continue to grow at a 10% rate into the foreseeable future, what is the highest price at which you would recommend purchasing this stock to your clients?ii. Suppose now that you determine that the company’s new product line will cause much higher growth in the near future. Your revised estimate is for a three-year period of 20% annual growth which will be followed by a return to the historical 10% growth rate. Under these new assumptions, what is the current value of the stock using the two-stage dividend growth model?iii. After…arrow_forwardThe annual rate of return on any given stock can be found as the stock's dividend for the year plus the change in the stock's price during the year, divided by its beginning-of-year price. If you obtain such data on a large portfolio of stocks, like those in the S&P 500, find the rate of return on each stock, and then average those returns, this would give you an idea of stock market returns for the year in question. true/falsearrow_forward
- As a financial advisor at ABC Corporation, the CEO asked you to analyze the followinginformation pertaining to two common stock investments, TI and SG. You are told that a oneyear Treasury Bill will have a rate of return of 5% over the next year. Also, information froman investment advising service lists the current beta for TI as 1.68 and for SG as 0.52. You areprovided a series of questions to guide your analysis. Economy Probability TI SG market Recession 30% -20% 5% -4% Average 20% 15% 6% 11% Expansion 35% 30% 8% 17% Boom 15% 50% 10% 27% 1. Using the probabilistic approach, calculate the expected rate of return for TI, SG and market.arrow_forwardAs a financial advisor at ABC Corporation, the CEO asked you to analyze the followinginformation pertaining to two common stock investments, TI and SG. You are told that a oneyear Treasury Bill will have a rate of return of 5% over the next year. Also, information froman investment advising service lists the current beta for TI as 1.68 and for SG as 0.52. You areprovided a series of questions to guide your analysis. Economy Probability TI SG market Recession 30% -20% 5% -4% Average 20% 15% 6% 11% Expansion 35% 30% 8% 17% Boom 15% 50% 10% 27% 4. Based on the beta provided, what is the expected rate of return for TI and SG for the nextyear?arrow_forwardAs a financial advisor at ABC Corporation, the CEO asked you to analyze the followinginformation pertaining to two common stock investments, TI and SG. You are told that a oneyear Treasury Bill will have a rate of return of 5% over the next year. Also, information froman investment advising service lists the current beta for TI as 1.68 and for SG as 0.52. You areprovided a series of questions to guide your analysis. Economy Probability TI SG market Recession 30% -20% 5% -4% Average 20% 15% 6% 11% Expansion 35% 30% 8% 17% Boom 15% 50% 10% 27% 2. Calculate the standard deviations in estimated rates of return for TI, SG and market.arrow_forward
 Intermediate Financial Management (MindTap Course...FinanceISBN:9781337395083Author:Eugene F. Brigham, Phillip R. DavesPublisher:Cengage Learning
 EBK CONTEMPORARY FINANCIAL MANAGEMENTFinanceISBN:9781337514835Author:MOYERPublisher:CENGAGE LEARNING - CONSIGNMENT
 Essentials Of Business AnalyticsStatisticsISBN:9781285187273Author:Camm, Jeff.Publisher:Cengage Learning,
 Fundamentals of Financial Management, Concise Edi...FinanceISBN:9781285065137Author:Eugene F. Brigham, Joel F. HoustonPublisher:Cengage Learning
 Fundamentals Of Financial Management, Concise Edi...FinanceISBN:9781337902571Author:Eugene F. Brigham, Joel F. HoustonPublisher:Cengage Learning
 Fundamentals of Financial Management, Concise Edi...FinanceISBN:9781305635937Author:Eugene F. Brigham, Joel F. HoustonPublisher:Cengage Learning