Videos
In fitting a least squares line ton= 15 data points, the following quantities were computed: SSxx = 55, SSyy = 198, SSxy = − 88,
a. Find the least squares line.
b. Graph the least squares line.
c. Calculate SSE.
d. Calculate s2.
e. Find a 90% confidence interval for β1. Interpret this estimate.
f. Find a 90% confidence interval for the
g. Find a 90% prediction interval for y when x = 15.
a.
To find: The least square line.
Answer to Problem 11.101LM
The fitted least square line is
Explanation of Solution
Given info: The values are
Calculation:
The least square line is obtained below,
Where,
Substitute the value
The value of
Therefore, the value of
Substitute the values
The value of
The value of
The fitted regression line is,
Therefore, the fitted least square line is
b.
To plot: The line
Answer to Problem 11.101LM
The plotted line is,
Explanation of Solution
Calculations:
To plot the line on the graph, first to obtain the at least two points on the line
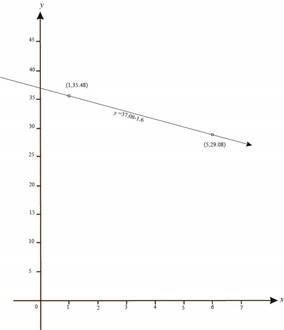
From the information, the line is
The two points are obtained below,
Let
Substitute the x value in equation (1) to get the value of y.
Therefore,
Let
Substitute the x value in equation (1) to get the value of y.
Therefore,
Based on the points
- 1. From the graph locate the value 1 on X-axis and 35.48 on Y-axis and mark the intersection point.
- 2. Locate the value 5 on X-axis and 29.08 on Y-axis and mark the intersection point.
- 3. Draw the line by combining the both intersection points.
- 4. The Graph is shown below.

c.
To find: The value of SSE.
Answer to Problem 11.101LM
Explanation of Solution
Calculations:
The formula for SSE is obtained below:
Substitute
The value of SSE is,
Therefore, the value of SSE is 57.2.
d.
To find: The value of
Answer to Problem 11.101LM
Explanation of Solution
Calculation:
Formula for
Substitute 57.2 for SSE and 15 for n in the formula.
The value of
Therefore, the value of
e.
To find: The 90% confidence interval for the slope
To interpret: The results.
Answer to Problem 11.101LM
The 90% confidence interval for the slope
Explanation of Solution
Calculation:
The formula for the confidence interval for estimate of
Where,
For confidence coefficient is 0.90. So that level of significance
The degrees of freedom is,
From table III Appendix D:
- 1. In the column locate the df as 13.
- 2. In the row locate the level of significance at 0.05.
- 3. The row and column of intersection point is 1.771 is the critical value.
Substitute
The 90% confidence interval for the slope
The 90% confidence interval for the slope
Interpretation:
It can be expected that the 90% confidence that each additional unit change in the mean value of y for each unit change in the x value is between –2.10 and –1.10.
f.
To find: The 90% confidence interval for the mean value of y when
Answer to Problem 11.101LM
The 90% confidence interval is.
Explanation of Solution
Calculations:
The formula for the 90% confidence interval is obtained below:
The estimated value for
The estimated value for
Substitute
The 90% confidence interval is,
Therefore, the 90% confidence interval is
g.
To find: The 90% prediction interval for the mean value of y when
Answer to Problem 11.101LM
Explanation of Solution
Calculations:
Formula for the 90% confidence interval is obtained below:
The estimated value for
The estimated value for
Substitute
The 90% prediction interval is,
Therefore, the 90% prediction interval is
Want to see more full solutions like this?
Chapter 11 Solutions
Statistics For Business And Economics, University Of Connecticut


- Computer output from a least-squares regression analysis based on a sample of size 17 is shown in the table. Term COEFCOEF SE CoefSE Coef TT Constant 7.43 0.59 12.59 xx 5.65 1.14 6.45 Assuming all conditions for inference are met, which of the following defines a 95 percent confidence interval for the slope of the least-squares regression line?arrow_forwardThe table below shows the numbers of bushels of barley cultivated per acre for 12 one-acre plots of land for two different strains of barley, PHT-34 and CBX-21. PHT-34 CBX-21 43 55 49 46 47 43 38 44 47 45 45 49 50 47 46 59 46 52 46 49 45 48 43 51 Determine the minimum data value, the quartiles, and the maximum data value for the PHT-34 and CBX-21 data sets. PHT-34 CBX-21 min Q1 Q2 Q3 maxarrow_forwardComputer output from a least-squares regression analysis based on a sample of size 17 is shown in the table. Term COEFCOEF SE CoefSE Coef TT Constant 7.43 0.59 12.59 xx 5.65 1.14 6.45 Assuming all conditions for inference are met, which of the following defines a 95 percent confidence interval for the slope of the least-squares regression line? 5.65±1.96(1.14)5.65±1.96(1.14) A 5.65±2.120(1.14)5.65±2.120(1.14) B 5.65±2.131(1.14)5.65±2.131(1.14) C 7.43±2.120(0.59)7.43±2.120(0.59) D 7.43±2.131(0.59) Earrow_forward
- A linear regression model was fit to a set of data containing 18 observations. The computer output of the regression analysis is shown in the table. Term CoefCoef SE CoefSE Coef TT Constant 12.00 5.43 2.210 xx 0.694 0.241 2.880 Assume the conditions for regression are met. Which of the following defines the margin of error when a 95 percent confidence interval for the slope of the least-squares regression line is calculated? (1.75)(0.241) A (1.75)(0.694) B (1.96)(0.241) C (2.12)(0.241)) D (2.12)(0.694) Earrow_forward1. The following table illustrates the BMI for a number of patients recently enrolled in a study investigating the relationship between BMI and type 2 diabetes. Participant BMI (kg/m2) A 26.5 B 19.2 C 29.7 D 27.4 E 30.2 F 28.9 A) Assuming the participants can be considered to be normally distributed, and that they comefrom a population with a σ=2.4 kg/m2, calculate a 95% confidence interval for the mean BMI ofthe population for which they represent.B) Correctly interpret the confidence interval you found above.arrow_forwardWhich of the following is assumed for establishing the unbiassedness of Ordinary Least Square(OLS) estimates? A) The sample value outcomes on the explanatory variable are all the same value B)The error term has the same variance given any value of the explanatory variable. C)The error term has an expected value of 1 given any value of the explanatory variable D) The regression equation is linear in the explained and explanatory variables.arrow_forward
- The following table illustrates the BMI for a number of patients recently enrolled in a study investigating the relationship between BMI and type 2 diabetes. Participant BMI (kg/m2) A 26.5 B 19.2 C 29.7 D 27.4 E 30.2 F 28.9 A) Assuming the participants can be considered to be normally distributed, and that they come from a population with a σ=2.4 kg/m , calculate a 95% confidence interval for the mean BMI of the population for which they represent and correctly interpret the confidence interval you found.arrow_forwardAn automotive company is considering two types of batteries for its automobile. Sample information on the life of the battery is collected for 20 batteries of type A and 20 batteries of type B. The summary statistics are XA = 40.21, xB = 39.53, SA = 1.23, and SB= 1.59. Assume the data on each battery are normally distributed and assume σA = σB.(a) Find a 95% confidence interval on μA – μB.(b) Draw some conclusion from (a) that provides some insight into whether A or B should be adopted.arrow_forwardIn exercise 7, the data on y = annual sales ($1000s) for new customer accounts andx = number of years of experience for a sample of 10 salespersons provided the estimatedregression equation yˆ = 80 + 4x. For these data x = 7, o(xi − x)2 = 142, and s = 4.6098.a. Develop a 95% confidence interval for the mean annual sales for all salespersons withnine years of experience.b. The company is considering hiring Tom Smart, a salesperson with nine years of experience.Develop a 95% prediction interval of annual sales for Tom Smart.c. Discuss the differences in your answers to parts (a) and (b).arrow_forward
- Two samples, sample one of size 16 and sample two of size 10, respectively, are drawn at random from two populations that are normally distributed. If their variances are found to be 24 and 18, respectively, find:i. 98% confidence interval for the ratio of the variances.ii. 90% confidence interval for the ratio of the variances.arrow_forwardIn order to determine a realistic price for a new product that a company wants to market the company’s research department selected 10 sites thought to have essentially identical sales potential and offered the product in each at a different price. The resulting sales are recorded in the accompanying table: Price ($) Sales ($1,000s) 15.00 15 15.50 14 16.00 16 16.50 9 17.00 12 17.50 10 18.00 8 18.50 9 19.00 6 19.50 5 c). Find the equation of the sample regression line using Minitab. d). Interpret the meaning of the coefficients of the equation of the sample regression line.arrow_forwardA group of six individuals with high cholesterol levels were given a new diet designed to lower cholesterol levels. Cholesterol levels, in milligrams per deciliter, were measured before and after the implementation of the diet for each individual, with the following results: Before After 227 160 234 174 257 178 269 170 218 178 248 178 A dietician claims that the mean reduction in cholesterol level is 51 milligrams per deciliter. Find the 98% confidence interval for the mean reduction in cholesterol level. Interpret the results. Does the 98% confidence interval contradict this claim?arrow_forward
 Linear Algebra: A Modern IntroductionAlgebraISBN:9781285463247Author:David PoolePublisher:Cengage Learning
 Glencoe Algebra 1, Student Edition, 9780079039897...AlgebraISBN:9780079039897Author:CarterPublisher:McGraw Hill