
Videos
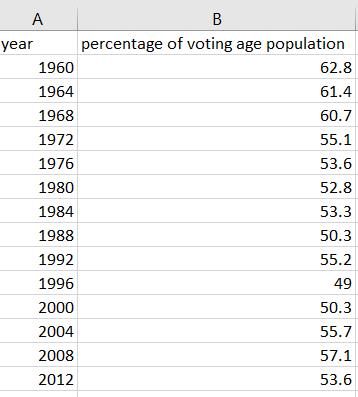
Graph the following data using a bar graph and a broken-line graph. (Source: U.S. Census Bureau)
Voter Turnout in U.S. Presidential Elections
To graph:The given table with the help of a bar graph and broken line graph.
Explanation of Solution
Graph:
Consider the given table,
Steps to draw the bar graph with the help of EXCEL:
Step-1 Open
Step-2 Write the year in column
Step-3 Select the values of column
The horizontal axis represents corporation and the vertical axis represents Revenue (Billions
For broken line graph, select the appropriate option in the CHART option.
Want to see more full solutions like this?
Chapter 11 Solutions
Finite Mathematics for Business, Economics, Life Sciences and Social Sciences Plus NEW MyLab Math with Pearson eText -- Access Card Package (13th Edition)


 Glencoe Algebra 1, Student Edition, 9780079039897...AlgebraISBN:9780079039897Author:CarterPublisher:McGraw Hill
 Holt Mcdougal Larson Pre-algebra: Student Edition...AlgebraISBN:9780547587776Author:HOLT MCDOUGALPublisher:HOLT MCDOUGAL
 Big Ideas Math A Bridge To Success Algebra 1: Stu...AlgebraISBN:9781680331141Author:HOUGHTON MIFFLIN HARCOURTPublisher:Houghton Mifflin Harcourt