
Concept explainers
Videos
Exercises refer to the following data:
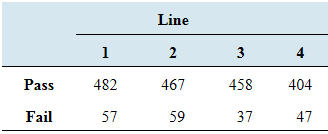
Electric motors are assembled on four different production lines. Random samples of motors are taken from each line and inspected. The numbers that pass and that fail the inspection are counted for each line, with the following results:
State a conclusion.
To state : the conclusion
Answer to Problem 9CQ
The value of chi-square statistics
So, do not reject
Explanation of Solution
Given information :
| Line | ||||
| 1 | 2 | 3 | 4 | |
| Pass | 482 | 467 | 458 | 404 |
| Fail | 57 | 59 | 37 | 47 |
Concept Involved:
In order to decide whether the presumed hypothesis for data sample stands accurate for the entire population or not we use the hypothesis testing.
The value of test statistics and the critical value identified from the table help us to decide whether to reject or do not reject null hypothesis.
The critical value from Table A.4, using degrees of freedom of contingency table of any given study is provided.
If
The values of two qualitative variables are connected and denoted in a contingency table. This table consists of rows and column. The variables in each row and each column of the table represent a category. The number of rows of contingency table is represented by letter ‘r’ and number of column of contingency table is represented by letter ‘c’.
The formula to find the number of degree of freedom of contingency table is
Calculation:
| Row totals reported | Column totals reported |
| Electric motors passed Electric motors failed | Electric motors in Line 1 Electric motors in Line 2 Electric motors in Line 3 Electric motors in Line 4 |
| Grand total = 482 + 467 + 458 + 404 + 57 + 59 + 37 + 47 = 2011 | |
From the results we have the below table:
| Line | |||||
| 1 | 2 | 3 | 4 | Row Total | |
| Pass | 482 | 467 | 458 | 404 | 1811 |
| Fail | 57 | 59 | 37 | 47 | 200 |
| Column Total | 539 | 526 | 495 | 451 | 2011 |
| Finding the expected frequency for the cell corresponding to: | The expected frequency |
| Electric motor that pass and in production Line 1 The row total is 1811, the column total is 539, and the grand total is 2011. | |
| Electric motor that pass and in production Line 2 The row total is 1811, the column total is 526, and the grand total is 2011. | |
| Electric motor that pass and in production Line 3 The row total is 1811, the column total is 495, and the grand total is 2011. | |
| Electric motor that pass and in production Line 4 The row total is 1811, the column total is 451, and the grand total is 2011. | |
| Electric motor that fail and in production Line 1 The row total is 200, the column total is 539, and the grand total is 2011 | |
| Electric motor that fail and in production Line 2 The row total is 200, the column total is 526, and the grand total is 2011. | |
| Electric motor that fail and in production Line 3 The row total is 200, the column total is 495, and the grand total is 2011. | |
| Electric motor that fail and in production Line 4 The row total is 200, the column total is 451, and the grand total is 2011. |
All the expected frequencies are at least 5. From the results of previous part we have the below table:
| Observed Frequency | Expected frequency |
| Line1234Pass482 467 458 404 Fail57 59 37 47 | Line1234Pass485.395 473.688 445.771 406.147 Fail53.605 52.312 49.229 44.853 |
| Finding the value of the chi-square corresponding to: | |
| Electric motor that pass and in production Line 1 Observed frequency is482 and expected frequency is 485.395 | |
| Electric motor that pass and in production Line 2 Observed frequency is467 and expected frequency is 473.688 | |
| Electric motor that pass and in production Line 3 Observed frequency is458 and expected frequency is 445.771 | |
| Electric motor that pass and in production Line 4 Observed frequency is404 and expected frequency is 406.147 | |
| Electric motor that fail and in production Line 1 Observed frequency is57 and expected frequency is 53.605 | |
| Electric motor that fail and in production Line 2 Observed frequency is59 and expected frequency is 52.312 | |
| Electric motor that fail and in production Line 3 Observed frequency is37 and expected frequency is 49.229 | |
| Electric motor that fail and in production Line 4 Observed frequency is47 and expected frequency is 44.853 |
To compute the test statistics, we use the observed frequencies and expected frequency:
Here r represents the number of rows and c represents the number of columns.
Given
| Degrees of freedom | Table A.4 Critical Values for the chi-square Distribution | |||||||||
| 0.995 | 0.99 | 0.975 | 0.95 | 0.90 | 0.10 | 0.05 | 0.025 | 0.01 | 0.005 | |
| 1 | 0.000 | 0.000 | 0.001 | 0.004 | 0.016 | 2.706 | 3.841 | 5.024 | 6.635 | 7.879 |
| 2 | 0.010 | 0.020 | 0.051 | 0.103 | 0.211 | 4.605 | 5.991 | 7.378 | 9.210 | 10.597 |
| 3 | 0.072 | 0.115 | 0.216 | 0.352 | 0.584 | 6.251 | 7.815 | 9.348 | 11.345 | 12.838 |
| 4 | 0.207 | 0.297 | 0.484 | 0.711 | 1.064 | 7.779 | 9.488 | 11.143 | 13.277 | 14.860 |
| 5 | 0.412 | 0.554 | 0.831 | 1.145 | 1.610 | 9.236 | 11.070 | 12.833 | 15.086 | 16.750 |
Want to see more full solutions like this?
Chapter 12 Solutions
Elementary Statistics ( 3rd International Edition ) Isbn:9781260092561


 Glencoe Algebra 1, Student Edition, 9780079039897...AlgebraISBN:9780079039897Author:CarterPublisher:McGraw Hill
 Big Ideas Math A Bridge To Success Algebra 1: Stu...AlgebraISBN:9781680331141Author:HOUGHTON MIFFLIN HARCOURTPublisher:Houghton Mifflin Harcourt