Best Buy Wal-Mart Amazon $88,988 Sales $40,339 $485,651 31,292 Cost of sales 62,752 365,086 Gross profit $ 9,047 $26,236 $120,565 Selling, general, and administrative expenses Operating expenses Income from operations 7,592 26,058 93,418 $ 1,450 $ 27,147 2$ 178


Q: What is the
A: Vertical analysis: The comparison of an item of a financial statement against the total amount of…
Q: Prepare a comparative common-size income statement for Jubilee Corporation. To an investor, how does…
A: Comparative analysis is used to measure the performance of the organization. It helps for the…
Q: A company reports the following income statement and balance sheet information for current year: Net…
A: Return on total assets means how much the total assets is able to give in return. The computation of…
Q: Lansing Company’s current-year income statement and selected balance sheet data at December 31 of…
A: The cash flow statement shows the cash inflow and cash outflow due to the operating activities,…
Q: Revenue and expense data for Innovation Quarter Inc. for two recent years are as follows: Current…
A: Under vertical analysis, each line item is presented as a percentage of base figure within the…
Q: A company reports the following income statement and balance sheet information for current year: Net…
A: Theory concept: Return on Assets : It tells the net income earned on total assets used by the…
Q: A condensed income statement for Simultech Corporation and a partially completed vertical analysis…
A: An income statement determines the net income of a business, by subtracting the operating expenses…
Q: Selected figures from the Balance Sheet and Income Statement of Turner's Toys, Inc. are shown below.…
A: Computation of net profit margin ratio:
Q: Express the following comparative income statements in common-size percents. Using the common-size…
A: percentage calculation = particulars / sales * 100 for example sales percentage = ($725000 /…
Q: McDougal Printing, Inc., had sales totaling $40,000,000 in fiscal year 2012. Some ratios for the…
A: Total sales = $40,000,000 Gross profit margin = 80% Operating profit margin = 35% Net profit…
Q: Use the following comparative income statements and balance sheets to complete the required ratio…
A: The following calculations are done to evaluate the liquidity analysis of the company.
Q: What is the company's times interest earned ratio?
A: Information Provided: Income before provision for income taxes = $1,025,959 Interest expense =…
Q: Two income statements for Satterfield Company are shown below. Satterfield Company Income…
A: The comparison in different year financial statement can be made on the basis of increase or…
Q: to measure the income of a firm under two different income measurement systems. The results for the…
A: Objectivity Concept In accounting the importance of objectivity concept which are rely upon in the…
Q: Vertical Analysis Revenue and expense data for Innovation Quarter Inc. for two recent years are as…
A: The income statement is prepared to estimate the net income or loss incurred during the period.
Q: The following data (in millions) are taken from the financial statements of Target Corporation:…
A: a.
Q: Income statement data for Winthrop Company for two recent years ended December 31 are as follows:…
A: (a)
Q: Vertical analysis of income statement Revenue and expense data for Innovation Quarter Inc. for two…
A: Under vertical analysis the income statement is compared in vertical form with respect to sales…
Q: Revenue and expense data for Young Technologies Inc. are as follows: Year 2 Year 1 Sales $500,000…
A: Vertical analysis: The comparison of an item of a financial statement against the total amount of…
Q: a. Calculate the following ratios for Company A and Company B. State clearly the formulae used for…
A: i. Gross Profit Margin = Gross Profit / Sales ii. Net Profit Margin = Net Profit / Sales iii.…
Q: A company reports the following income statement and balance sheet information for the current year:…
A: Return on Total Assets= Earnings Before Interest and Tax/ Average Total Assets
Q: The following data were taken from the records of Browntree Corporation at the end of the fiscal…
A: Multi Step Income statement is that income statement which shows all incomes and all expenses of the…
Q: UUsing the following income statements, perform the calculations needed for horizontal analyses.…
A: Financial statements can be examined utilizing: (1) Horizontal analysis and (2) Verticle analysis In…
Q: Two income statements for Satterfield Company are shown below. Satterfield Company Income Statements…
A: Income statement: It is one of the financial statements prepared by an organization. This statement…
Q: Perform a comparative analysis of Eastman Corporation by completing the analysis below. Describe and…
A:
Q: Revenue and expense data for Bluestem Company are as follows: Year 2 Year 1 Administrative expenses…
A: All the items will be shown as a percentage of the total sales.
Q: a. Prepare a common-sized income statement comparing the results of operations for Sorenson…
A: Common size income statement is used for vertical analysis wherein each item in the income statement…
Q: Express the following comparative income statements in common- size percents and assess whether or…
A: Computation of common size income statement.
Q: Ratio Analysis of Comparative Financial Statements Amounts from the comparative income statement…
A: Ratio analysis is a process of analyzing the ratios which is meant to understand the performance of…
Q: Two income statements for Cornea Company follow: Cornea Company Income Statements For the Years…
A: Comparative balance sheet used to compare the financial statement of two or more periods. It is…
Q: Ratio Analysis of Comparative Financial Statements Amounts from the comparative income statement…
A: Ratio analysis is one of the analytical tools where the data is quantified in such format to analyse…
Q: Using the income statement information for Omega Corporation that follows, prepare a vertical…
A: Formula: Gross profit = sales - cost of goods sold.
Q: For the first picture, I need help finding the decimal number beside each number For the second…
A: Financial Statements: Financial statements are considered as a summary of the events that took place…
Q: Express the following comparative income statements in common-size percents. Using the common-size…
A: Common size analysis of income statement shows each item of the income statement as a percentage of…
Q: The following data (in millions) were taken from the financial statements of Costco Whole- sale…
A: Horizontal analysis of income statement: In horizontal analysis of income statement, the amount of…
Q: Revenue and expense data for the current calendar year for Tannenhill Company and for the…
A: a.Prepare a common-sized income statement comparing the results of operations for Tannenhill Company…
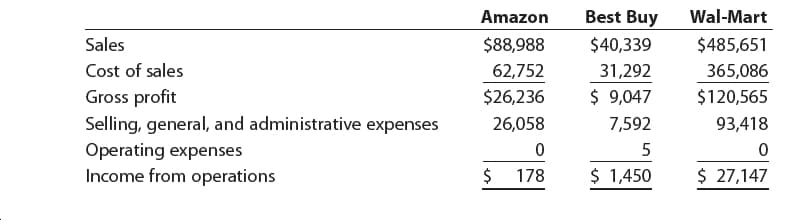
Q: The condensed income statements through income from operations for Amazon.com, Inc., Best Buy, Inc.,…
A:
Q: The income statements for Finac Company for the two years are as follows: Year 2 Year 1 Sales…
A: Common Size Income Statement:-It is a statement that shows the income statement expressed in the…
Q: Selected information for 5 companies is reproduced below: a) Calculate the net profit ratio for each…
A: Net Profit Ratio: Creditors and investors use this ratio to measure how effectively a company can…
Q: For 20Y2, Macklin Inc. reported a significant increase in net income. At the end of the year, John…
A: 1. Prepare a comparative income statement with horizontal analysis for the two years period using…
Q: Required: 1. Complete the below table to calculate each year's current ratio. Current Ratio…
A: Current ratio is an accounting ratio used to express the current assets in relation to the current…
Q: Footfall Manufacturing Ltd. reports the following financial information at the end of the current…
A: Note: Since you have asked multiple question, we will solve the first question for you. If you want…
Q: You are asked to provided a comparative financial statement analysis of Star Corporation and Moon…
A: 1) Current ratio = Current assets / current liabilities 2) Accounts receivable turnover = net sales…
Q: How do you solve this problem (only asking about Problem 1-4. Wasn't sure if you need the previous…
A: Prepare a comparative income statement analysis of Eastman corporation as shown below:
Q: Refer to the following selected company information to determine the Year 1 and Year 2 common size…
A: Lets understand the basics. Common size income statement is prepared to show all variable in…
Q: 2021 2020 Service revenue $523,000 $476,000 385,500 Operating expenses Income tax expense 319,800…
A: Comparative financial statements are used to analyze the financial situation of the business entity.…
Q: Single-Step Income Statement The following selected accounts and their current balances appear in…
A: Financial Statements are prepared by the management for reporting purposes. These are the essential…
Q: The following income statement data for AT&T Inc. and Verizon Communications Inc. were taken from…
A: Vertical statement is the analysis of the financial statement of a company by showing each item as a…
The condensed income statements through income from operations for Amazon.com, Inc., Best Buy, Inc., and Wal-Mart Stores, Inc. for a recent fiscal year follow (in millions):
Please see the attachment for details:
1. Prepare comparative common-sized income statements for each company. Round percentages to one decimal place.
2. Use the common-sized analysis to compare the financial performance of
the three companies.


Trending now
This is a popular solution!

Step by step
Solved in 2 steps with 1 images


- Sales revenue $39,900 $75,300 $573,800 $35,400 $55,100Cost of goods sold 19,000 49,500 265,900 19,300 30,200Operating expenses 10,100 40,500 233,700 11,900 18,300 Total expenses 29,100 90,000 499,600 31,200 48,500Operating profit (loss) $10,800 $(14,700) $74,200 $4,200 $6,600Identifiable assets $35,200 $79,900 $493,400 $66,300 $49,900 Prepare the necessary disclosures required by GAAPGain Sharing Plans. A company recorded sales of P9,810,000 for the 1st quarter. Inventory for sale amounted to P350,000. The company incurred an actual cost of P7,600,000. For the following quarter of operations, the company recorded sales of P7, 860,000 and incurred a cost of P6, 835,000. Inventory amounted to P580,000. The company allows cost amounting of 80% of sales value of production. The company uses Scanlon plan to incentivize its employees. Compute for the bonus to be distributed to employees, company share and the amount reserve if the employees received 60% of the gain and 20% of it becomes part of the reserve. Assume that there are 116,000 participating employees. Use the sample Scanlon Plan format in the discussions.Income Statement - Cover-to-Cover Cover-to-Cover CompanyContribution Margin Income StatementFor the Year Ended December 31, 20Y8 Sales $379,000 Variable costs: Manufacturing expense $227,400 Selling expense 18,950 Administrative expense 56,850 (303,200) Contribution margin $75,800 Fixed costs: Manufacturing expense $5,000 Selling expense 4,000 Administrative expense 9,950 (18,950) Operating income $56,850 Income Statement - Biblio Files Biblio Files CompanyContribution Margin Income StatementFor the Year Ended December 31, 20Y8 Sales $379,000 Variable costs: Manufacturing expense $151,600 Selling expense 15,160 Administrative expense 60,640 (227,400) Contribution margin $151,600 Fixed costs: Manufacturing expense $76,750 Selling expense 8,000 Administrative expense 10,000 (94,750) Operating income $56,850 Sales Mix Biblio Files Company is making plans…
- Marshall Inc. Comparative Income Statement For the Years Ended December 31, 20Y2 and 20Y1 1 20Y2 20Y1 2 Sales $10,850,000.00 $10,000,000.00 3 Cost of goods sold 6,000,000.00 5,450,000.00 4 Gross profit $4,850,000.00 $4,550,000.00 5 Selling expenses $2,170,000.00 $2,000,000.00 6 Administrative expenses 1,627,500.00 1,500,000.00 7 Total operating expenses $3,797,500.00 $3,500,000.00 8 Income from operations $1,052,500.00 $1,050,000.00 9 Other revenue 99,500.00 20,000.00 10 $1,152,000.00 $1,070,000.00 11 Other expense (interest) 132,000.00 120,000.00 12 Income before income tax $1,020,000.00 $950,000.00 13 Income tax expense 420,000.00 400,000.00 14 Net income $600,000.00 $550,000.00 Marshall Inc. Comparative Balance Sheet December 31, 20Y2 and 20Y1 1 20Y2 20Y1 2 Assets…Marshall Inc. Comparative Income Statement For the Years Ended December 31, 20Y2 and 20Y1 1 20Y2 20Y1 2 Sales $10,850,000.00 $10,000,000.00 3 Cost of goods sold 6,000,000.00 5,450,000.00 4 Gross profit $4,850,000.00 $4,550,000.00 5 Selling expenses $2,170,000.00 $2,000,000.00 6 Administrative expenses 1,627,500.00 1,500,000.00 7 Total operating expenses $3,797,500.00 $3,500,000.00 8 Income from operations $1,052,500.00 $1,050,000.00 9 Other revenue 99,500.00 20,000.00 10 $1,152,000.00 $1,070,000.00 11 Other expense (interest) 132,000.00 120,000.00 12 Income before income tax $1,020,000.00 $950,000.00 13 Income tax expense 420,000.00 400,000.00 14 Net income $600,000.00 $550,000.00 Marshall Inc. Comparative Balance Sheet December 31, 20Y2 and 20Y1 1 20Y2 20Y1 2 Assets…Marshall Inc. Comparative Income Statement For the Years Ended December 31, 20Y2 and 20Y1 1 20Y2 20Y1 2 Sales $10,850,000.00 $10,000,000.00 3 Cost of goods sold 6,000,000.00 5,450,000.00 4 Gross profit $4,850,000.00 $4,550,000.00 5 Selling expenses $2,170,000.00 $2,000,000.00 6 Administrative expenses 1,627,500.00 1,500,000.00 7 Total operating expenses $3,797,500.00 $3,500,000.00 8 Income from operations $1,052,500.00 $1,050,000.00 9 Other revenue 99,500.00 20,000.00 10 $1,152,000.00 $1,070,000.00 11 Other expense (interest) 132,000.00 120,000.00 12 Income before income tax $1,020,000.00 $950,000.00 13 Income tax expense 420,000.00 400,000.00 14 Net income $600,000.00 $550,000.00 Marshall Inc. Comparative Balance Sheet December 31, 20Y2 and 20Y1 1 20Y2 20Y1 2 Assets…
- Marshall Inc. Comparative Income Statement For the Years Ended December 31, 20Y2 and 20Y1 1 20Y2 20Y1 2 Sales $10,850,000.00 $10,000,000.00 3 Cost of goods sold 6,000,000.00 5,450,000.00 4 Gross profit $4,850,000.00 $4,550,000.00 5 Selling expenses $2,170,000.00 $2,000,000.00 6 Administrative expenses 1,627,500.00 1,500,000.00 7 Total operating expenses $3,797,500.00 $3,500,000.00 8 Income from operations $1,052,500.00 $1,050,000.00 9 Other revenue 99,500.00 20,000.00 10 $1,152,000.00 $1,070,000.00 11 Other expense (interest) 132,000.00 120,000.00 12 Income before income tax $1,020,000.00 $950,000.00 13 Income tax expense 420,000.00 400,000.00 14 Net income $600,000.00 $550,000.00 Marshall Inc. Comparative Balance Sheet December 31, 20Y2 and 20Y1 1 20Y2 20Y1 2 Assets…Marshall Inc. Comparative Income Statement For the Years Ended December 31, 20Y2 and 20Y1 1 20Y2 20Y1 2 Sales $10,850,000.00 $10,000,000.00 3 Cost of goods sold 6,000,000.00 5,450,000.00 4 Gross profit $4,850,000.00 $4,550,000.00 5 Selling expenses $2,170,000.00 $2,000,000.00 6 Administrative expenses 1,627,500.00 1,500,000.00 7 Total operating expenses $3,797,500.00 $3,500,000.00 8 Income from operations $1,052,500.00 $1,050,000.00 9 Other revenue 99,500.00 20,000.00 10 $1,152,000.00 $1,070,000.00 11 Other expense (interest) 132,000.00 120,000.00 12 Income before income tax $1,020,000.00 $950,000.00 13 Income tax expense 420,000.00 400,000.00 14 Net income $600,000.00 $550,000.00 Marshall Inc. Comparative Balance Sheet December 31, 20Y2 and 20Y1 1 20Y2 20Y1 2 Assets…Marshall Inc. Comparative Income Statement For the Years Ended December 31, 20Y2 and 20Y1 1 20Y2 20Y1 2 Sales $10,850,000.00 $10,000,000.00 3 Cost of goods sold 6,000,000.00 5,450,000.00 4 Gross profit $4,850,000.00 $4,550,000.00 5 Selling expenses $2,170,000.00 $2,000,000.00 6 Administrative expenses 1,627,500.00 1,500,000.00 7 Total operating expenses $3,797,500.00 $3,500,000.00 8 Income from operations $1,052,500.00 $1,050,000.00 9 Other revenue 99,500.00 20,000.00 10 $1,152,000.00 $1,070,000.00 11 Other expense (interest) 132,000.00 120,000.00 12 Income before income tax $1,020,000.00 $950,000.00 13 Income tax expense 420,000.00 400,000.00 14 Net income $600,000.00 $550,000.00 Marshall Inc. Comparative Balance Sheet December 31, 20Y2 and 20Y1 1 20Y2 20Y1 2 Assets…
- Marshall Inc. Comparative Income Statement For the Years Ended December 31, 20Y2 and 20Y1 1 20Y2 20Y1 2 Sales $10,850,000.00 $10,000,000.00 3 Cost of goods sold 6,000,000.00 5,450,000.00 4 Gross profit $4,850,000.00 $4,550,000.00 5 Selling expenses $2,170,000.00 $2,000,000.00 6 Administrative expenses 1,627,500.00 1,500,000.00 7 Total operating expenses $3,797,500.00 $3,500,000.00 8 Income from operations $1,052,500.00 $1,050,000.00 9 Other revenue 99,500.00 20,000.00 10 $1,152,000.00 $1,070,000.00 11 Other expense (interest) 132,000.00 120,000.00 12 Income before income tax $1,020,000.00 $950,000.00 13 Income tax expense 420,000.00 400,000.00 14 Net income $600,000.00 $550,000.00 Marshall Inc. Comparative Balance Sheet December 31, 20Y2 and 20Y1 1 20Y2 20Y1 2 Assets…Income Statement - Cover-to-Cover Cover-to-Cover CompanyContribution Margin Income StatementFor the Year Ended December 31, 20Y8 Sales $404,000 Variable costs: Manufacturing expense $242,400 Selling expense 20,200 Administrative expense 60,600 (323,200) Contribution margin $80,800 Fixed costs: Manufacturing expense $5,000 Selling expense 4,000 Administrative expense 11,200 (20,200) Operating income $60,600 Income Statement - Biblio Files Biblio Files CompanyContribution Margin Income StatementFor the Year Ended December 31, 20Y8 Sales $404,000 Variable costs: Manufacturing expense $161,600 Selling expense 16,160 Administrative expense 64,640 (242,400) Contribution margin $161,600 Fixed costs: Manufacturing expense $83,000 Selling expense 8,000 Administrative expense 10,000 (101,000) Operating income $60,600 Sales Mix Biblio Files Company is making plans…SCRUMPTIOUS CUPCAKESProfit and loss accountfor the year ended 30 April 20202020£SalesSales 220,000Cost of sales 120,000Gross Profit 100,000ExpensesSalaries 24,000Other Fixed cost 4,800Distribution 3,000Advertising 4,500Rent 13,200AHUtilities 3,600Other Cost 4,00057,100Operating Profit 42,900 SCRUMPTIOUS CUPCAKESBalance Sheetas at 30 April 20202020£Fixed assetsIntangible assets -Tangible assets 35,000Investments -35,000Current assetsStocks 3,000Debtors 10,000Cash at bank and in hand 6,30019,300Written ReportsCreditors: amounts falling duewithin one year (11,300)Net Current Assets 8,000Total assets less currentliabilities 43,000Net Assets 43,000Capital and reservesCalled up share capital 100Profit and loss account 42,900Shareholders' funds 43,000 please calculate the folliwing ratios: Profitability Ratios – Gross Profit Margin, Net Profit Margin and ROCE● Liquidity – Current Test and Acid Test● Gearing● Activity/Performance – Stock Turnover, Debtors’ Collection Period and AssetTurnover…


