
Concept explainers
Videos
Exercises 55-58 refer to the following plot of some level curves of
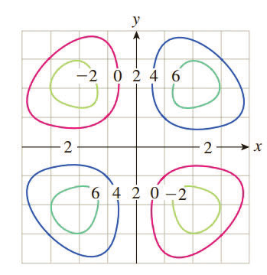
Estimate:
a.
b.
c.
Want to see the full answer?
Check out a sample textbook solution
Chapter 15 Solutions
Finite Mathematics and Applied Calculus (MindTap Course List)


- Using the table from Exercise 5, sketch the graph of 2x+3y=12.arrow_forwardIn Exercises 1–6, sketch the given curves together in the appropriate coordinate plane and label each curve with its equation.1. y = 2x, y = 4x, y = 3-x, y = (1>5)xarrow_forwardProve that for any point (a, b) ≠ (0, 0) on the parabola y = x2 , the normal line intersects the graph a second timearrow_forward
- In Exercises 13–16, find and sketch the level curves ƒ(x, y) = c on the same set of coordinate axes for the given values of c. We refer to these level curves as a contour map.arrow_forwardGiven are data on x= age and y= number of days after arthroscopic shoulder surgery before being able to return to sport for 10 weight lifters: x 33 31 32 28 33 26 34 32 28 27 y 6 4 4 1 3 3 4 2 3 2 1. Construct a scatterplot, and comment on any interesting features observed. To plot, use your knowledge in plotting points in the Cartesian plane (rectangular coordinate system) but this time limit your axes to positive x-axis and positive y-axis. 2.arrow_forward
 Linear Algebra: A Modern IntroductionAlgebraISBN:9781285463247Author:David PoolePublisher:Cengage Learning
 Algebra & Trigonometry with Analytic GeometryAlgebraISBN:9781133382119Author:SwokowskiPublisher:Cengage
 Elementary Geometry For College Students, 7eGeometryISBN:9781337614085Author:Alexander, Daniel C.; Koeberlein, Geralyn M.Publisher:Cengage,