TABLE 17.25 FOOD AND BEVERAGE SALES FOR THE VINTAGE RESTAURANT ($1000s) Month First Year Second Year Third Year January 242 235 232 263 238 247 282 255 265 205 February March 193 April Мay June 178 184 193 210 140 149 157 160 July August September Otober 145 152 166 174 126 161 110 122 130 130 148 November 152 167 173 December 206 230 235


Unitary Method
The word “unitary” comes from the word “unit”, which means a single and complete entity. In this method, we find the value of a unit product from the given number of products, and then we solve for the other number of products.
Speed, Time, and Distance
Imagine you and 3 of your friends are planning to go to the playground at 6 in the evening. Your house is one mile away from the playground and one of your friends named Jim must start at 5 pm to reach the playground by walk. The other two friends are 3 miles away.
Profit and Loss
The amount earned or lost on the sale of one or more items is referred to as the profit or loss on that item.
Units and Measurements
Measurements and comparisons are the foundation of science and engineering. We, therefore, need rules that tell us how things are measured and compared. For these measurements and comparisons, we perform certain experiments, and we will need the experiments to set up the devices.
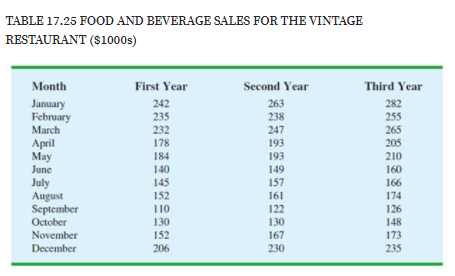
Forecasting Food and Beverage Sales
The Vintage Restaurant, on Captiva Island near Fort Myers, Florida, is O\vned and operated by Karen Payne. The restaurant just completed its third year of operation. Since opening her restaurant, Karen has sought to establish a reputation for Vintage as a high-quality dining establishment that specializes in fresh seafood. Through the efforts of Karen and her staff, her restaurant has become one of the best and fastest-growing restaurants on the island.
To better plan for the future growth of the restaurant, Karen needs to develop a system that will enable her to forecast food and beverage sales by month for up to one year in advance. Table 17.25 shows the value of food and beverage sales ($1000s) for the first three years of operation.
Managerial Report
Perform an analysis of the sales data for the Vintage Restaurant. Prepare a report for Karen that summarizes your findings, forecasts, and recommendations. Include the following:
- A time-series plot. Comment on the underlying pattern in the time series.
- An analysis of the seasonality of the da Indicates the seasonal indexes for each month and comment on the high and low seasonal sales months. Do the seasonal indexes make intuitive sense? Discuss.
-
- Deseasonalize the time series. Does there appear to be any trend in the deseasonalized time series?
- Using the time series decomposition method, forecast sales for January through December of the fourth year.
- Using the dummy variable regression approach, forecast sales for January through December of the fourth year.
- Provide summary tables of your calculations and any graphs in the appendix of your report.
Assume that January sales for the fourth year turn out to be $295,000. What was your forecast error? If this error is large. Karen may be puzzled about the difference between even your forecast and the actual sales value. What can you do to resolve her uncertainty in the forecasting procedure?


Trending now
This is a popular solution!

Step by step
Solved in 3 steps with 2 images


