
(a)
The price on the vertical axis and quantity on the horizontal axis and to plot the first two columns.
Answer to Problem 1E
Hence, the price along the vertical axis and the quantity along the horizontal axis has been determined and the first two columns have been plotted.
Explanation of Solution
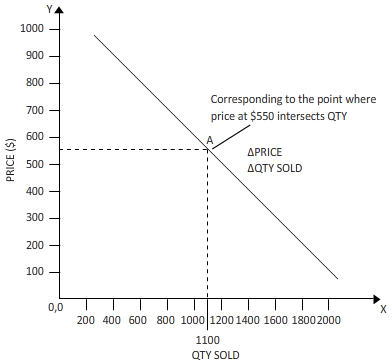
The graph is plotted by joining 3 points of price on Y-axis to the corresponding quantity sold on the X-axis.
To find the quantity sold when the price is a certain dollar, we can take the help of the line obtained by plotting 3 price point in the Y-axis to the corresponding quantity in the x-axis in the graph sheet, and join them to form a sloping straight line.
Once the new quantity is found for a particular price point from the above straight line, we can use this information to find the total revenue at that price.
(b)
The quantity sold when the price is $550.
Answer to Problem 1E
When the price is 550$, the quantity sold is 1100.
Explanation of Solution
From the above-plotted line on the graph, we find that the point when the price on Y-axis is 550$, the corresponding quantity sold on X-axis is 1100 numbers.
To find the quantity sold when the price is a certain dollar, we can take the help of the line obtained by plotting 3 price point in the Y-axis to the corresponding quantity in the x-axis in the graph sheet, and join them to form a sloping straight line.
Once the new quantity is found for a particular price point from the above straight line, we can use this information to find the total revenue at that price.
(c)
To plot a graph and to measure the quantity on the horizontal axis and to determine the total revenue on the vertical axis.
Answer to Problem 1E
The graph is plotted and the quantity sold at 550$ is 1100 numbers.
Explanation of Solution
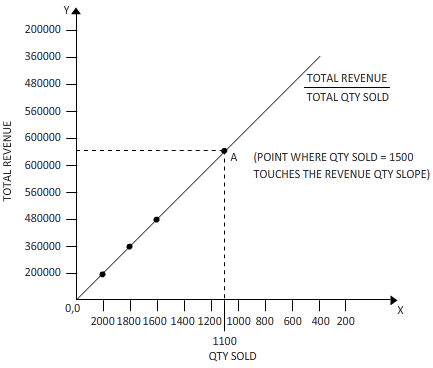
Now in the graph drawn above, the quantity sold is taken on X-axis while the total revenue obtained for that numbers of corresponding quantity sold is taken on Y-AXIS.
Next, we plot the points of total quantity sold on the horizontal X-axis versus the total Revenue obtained by selling each number of that quantity on the vertical Y-Axis. We take such thee points where the quantity-sold and corresponding revenue interacts, and join them to form a straight line.
To find the quantity sold when the price is at a certain dollar, we can take the help of the line obtained by plotting 3 price point in the Y-axis to the corresponding quantity in the x-axis in the graph sheet, and join them to form a sloping straight line.
Once the new quantity is found for a particular price point from the above straight line, we can use this information to find the total revenue at that price.
(d)
The total revenue when the price is $550 and to determine if the total revenue will increase or decrease when the price is lowered.
Answer to Problem 1E
When the quantity sold is $ 550, the total revenue is $ 6,40,000.
Explanation of Solution
We already know the quantity sold at each price point. Conversely, we know the price too when a particular number of items is sold. In this problem, the total revenue is to be found when the price is 550$. Now the corresponding total revenue to 1100 numbers is found to be 6,40,000 on the Y-axis. As we can see from the graph, decrease in price will increase the revenue.
To find the quantity sold when the price is a certain dollar, we can take the help of the line obtained by plotting 3 price point in the Y-axis to the corresponding quantity in the x-axis in the graph sheet, and join them to form a sloping straight line.
Once the new quantity is found for a particular price point from the above straight line, we can use this information to find the total revenue at that price.
Want to see more full solutions like this?
Chapter 1A Solutions
Microeconomics (MindTap Course List)

- This is a difficult question. Take your time to match the term to its definition or description. Complement Inferior Good Normal Good Substitute A. E1<0 B. EXY<0 C. E1>0 D. EXY>0arrow_forwardI only need part D to be answered . Thank you! Demand and supply often shift in the retail market for gasoline. Here are two demand curves and two supply curves for gallons of gasoline in the month of May in a small town in Maine. Some of the data are missing. Using the table, answer the following questions: Quantities Demanded Quantities SuppliedPrice D1 D2 S1 S2$7.00 5,000 7,500 9,000 9,5006,000 8,000 8,000 9,0005.00 8,500 8,5009,000 5,000 Use the following facts to fill in the missing data in the table. If demand is D1 and supply is S1, the equilibrium quantity is 7,000 gallons per month. When demand is D2 and supply is S1, the equilibrium price is $6.00 per gallon. When demand is D2 and supply is S1, there is an excess demand of 4,000 gallons per month at a price of $4.00 per gallon. If demand is D1 and supply is S2, the equilibrium quantity is 8,000 gallons per month. b. Compare the two equilibriums: In the first, demand is D1 and supply is S1. In the second, demand is D1 and…arrow_forwardI used to buy 3 movies a month, but when Connecting U dropped the price of a gigabyte of data from a high of $20 to a low of $14.48 (a total decrease of 32.02 percent according to the midpoint formula), I want to buy 5 movies a month. A) My demand for movies increases by 33.34% B) My demand for movies increases by 66.67% C) My demand for movies increases by 50% Note:- Do not provide handwritten solution. Maintain accuracy and quality in your answer. Take care of plagiarism. Answer completely. You will get up vote for sure.arrow_forward
- The diagram below shows a demand line (green) and revenue curve (red) for a certain good. The horizontal axis is price in £. For the demand line, the vertical axis gives the number of units sold. Find the equation of the green line, the demand ? in terms of price ? and the correct equation of revenue curve.arrow_forwardCombine parts 1 and 2. Suppose that the FDA increase regulation of coffee, and a reputable study is published indicating that coffee drinkers have higher rates of Alzheimer’s. What with the combined impact have on the equilibrium price and quantity of coffee? Explain your reasoning and show graphically. Make sure you think this through carefully!arrow_forwardUse the second picture to select the answer for: Seller reservation pricearrow_forward
- The table below shows the market for AA batteries in Tulsa, Oklahoma, when tornadoes threaten the area. Market for AA Batteries with Tornado Threat Quantity of Quantity of Batteries Batteries Demanded Supplied (packages) 100 80 60 40 20 Price (dollars) $15 13 9 7 5 (packages) 40 50 60 70 80 90 Note:- Do not provide handwritten solution. Maintain accuracy and quality in your answer. Take care of plagiarism. Answer completely. You will get up vote for sure.arrow_forwarda) What is the value of the slope of the demand curve? A: (5.5, 38.5) B: (11, 33) C: (33, 11) D: (38.5, 5.5) Note:- Do not provide handwritten solution. Maintain accuracy and quality in your answer. Take care of plagiarism. Answer completely. You will get up vote for sure.arrow_forwardPricing Scenario: You just won a new laptop in a contest, and you decide to sell your old one. You do not have a lot of money and want to get the highest price possible for your old laptop. It is a Mac that you bought brand new last year. You are listing the laptop online, and you need to identify the price Do you believe the demand for your laptop will be elastic or inelastic?arrow_forward
- How does the equilibrium price and quantity change when here are bad rumors about a product? Are there any changes or none? Provide a graph of your answerarrow_forwardQuestion 2 Plot the demand curve from the demand schedule information provided. Price Quantity Demand (Qd) 1 9 2 6 3 4 4 3 5 2 (a) What can you explain from the graph? (b) Can you identify any determinants? (c) What happens if price changes? (d) What else do you think will happen? (e) What happens if other determinants change? Requestion solution for subsection ( d ) and (e)arrow_forwardWhich of the following would NOT change demand? * a)information about the product's health effects b)the price of related products c)the income of the consumers d)the price of the productarrow_forward
