Concept explainers
Videos
For Questions 1 through 3, interpret the position graph given in each figure by writing a very short “story” of what is happening. Be creative! Have characters and situations! Simply saying that “a car moves 100 meters to the right” doesn’t qualify as a story. Your stories should make specific reference to information you obtain from the graph, such as distance moved or time elapsed.
Short story which interprets the graph.
Explanation of Solution
Given:
Distance versus time graph.
Paul is 5 mi away from the home at a car shop. He traveled to the barber shop and covered the distance of 5 mi, in further 20 mins he reached a barber shop, where he had a haircut in 20 min. Then, he traveled back home with the same speed and covered 10mi in 40 mins.
Consider the figure of the movement indicating the movement of Paul,
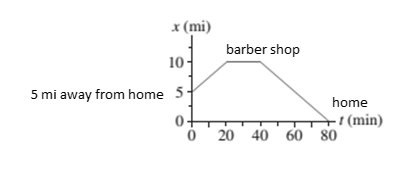
Figure.1
Conclusion:
This figure indicates the movement of Paul, and variation in distance with respect to time.
Want to see more full solutions like this?
Chapter 2 Solutions
Physics for Scientists and Engineers: A Strategic Approach with Modern Physics (4th Edition)
Additional Science Textbook Solutions
College Physics
Physics: Principles with Applications
Sears And Zemansky's University Physics With Modern Physics
An Introduction to Thermal Physics
Conceptual Physics: The High School Physics Program
Applied Physics (11th Edition)


- The position vs. time graph of a moving particle for a time interval of 23 seconds is shown below. Each square unit in the horizontal axis corresponds to one second, and each square unit in the vertical axis corresponds to one meter. What is the displacement of the particle for the entire 23 seconds? m What is the distance traveled by the particle for the entire 23 seconds? m What is the average speed of the particle from t = 0 s to t = 5 s? m/s What is the instantaneous velocity of the particle at t = 11 s? m/s What is the average velocity of the particle from t = 17 s to t = 18 s? m/sarrow_forwardThe bush baby, a small African mammal, is a remarkable jumper. Although only about 8 inches long, it can jump, from am standing start, straight up to a height of over 7 feet! Use the particle model to draw a motion diagram for a bush baby’s jump, from its start until it reaches its highest point.arrow_forwardA cannon ball is launched into the air with an upward velocity of 294 feet per second, from a 10-foot tall cannon. The height hh of the cannon ball after tt seconds can be found using the equation h=−16t2+294t+10h=-16t2+294t+10. A) What was the initial height of the cannon ball? feet B) How many seconds will it take for the cannon ball to hit the ground? secondsarrow_forward
- At time t0=0.0s, a car, starting from rest, moves south. It continues moving south, and by time tf =121s, it has covered a distance of d=6689m. Take north as the positive x direction, as indicated in the figure. Part A: What is the car's average speed, in meters per second, during this period? Part B: What is the car's displacement, in meters, during this period? Part C: What is the car's average velocity, in meters per second, during this period? Part D: A different car, after starting from rest at t0 =0.0s, travels for the same period, tf =121s, attaining a final velocity of vf =−30.0m/s. What is this car's average acceleration, in meters per squared seconds, during the period described?arrow_forwardYou decide to travel by car for your holiday visits this year. You leave early in the morning to avoid congestion on the roads. This enables you to drive at a comfortable speed of v1=67.1 mph for t1=1.70 hours. However, after this time, you unexpectedly come to a stop for tstop=43.8 min. Traffic starts moving again and you finish your travel at v2=55.6 mph for an additional t2=1.40 hours. There are 1609 meters in one mile. What was the total distance d traveled? What was the average speed v?arrow_forward1) The motions of a car and a motorbike along a straight road are described by the velocity vs time graph provided below. The two vehicles are initially alongside each other at time t=0 s. The motorbike’s speed is 18.1 m/s and the time T is 59.9 s. a) what distance has the motorbike travelled between 0 and T (in km)? b) What distance has the car traveled between 0 and T (in km)? 2) Which of these statements is true? a. At T, the car and motorbike are at the same location. b. the acceleration of the car is constant between 0 and T c. the acceleration of the motorbike is 0 d. the acceleration of the car is 0 3) a)What is the car's average speed for the first T seconds? (in m/s) b) What is the motorbike's average speed for the first T seconds (in m/s)arrow_forward
- A bus moves along an x-axis a distance of 800 m, starting at rest (at x = 0) and ending at rest (at x = 800 m). Through the first 2 of that distance, its acceleration is +2.15 m/s?. Through the rest of the distance, its acceleration is -0.92 m/s?. Calculate a) time taken to cover the first half of the distance? b) the bus's maximum speed? c) total time to cover 800 m distance? Sketch velocity time graphs.arrow_forwardThe equation for the best-fit line for the velocity vs. time graph for a particle is v=5.1t+7.9, What is the acceleration of the particle? All the quantities are measured in standard units. Do not include units in your answers and keep one decimal place.arrow_forwardThe positions of two objects over a 9 second time interval are shown in the graph below. The blue line represents the position of object A while the orange line represents the position of object B. Which of the following statements is true about the average velocities of objects A and B in the time interval from 0 to 6 seconds? a) Vavg, A> Vavg, B b) Vavg, A= Vavg, B c) Vavg, A< Vavg, Barrow_forward
- In kinematics it may be necessary to analyze a situation in which particles do not exhibit regular displacement throughout their movement, so that we cannot use just a mathematical equation to describe their velocity, acceleration and displacement. In cases like these, we use graphs to represent the motion of a particle, since the fundamental equations of speed and acceleration have geometric relationships with the graphs that represent them. Regarding the graphs of acceleration as a function of time, position as a function of time and speed as a function of time, it can be stated that: Choose one:a. The difference between velocities v2 and v1 is numerically equal to the area under the position curve between time t1 and t2, and therefore can be calculated by the derivative: v2-v1 = dS / dt. The difference between the accelerations a1 and a2 is numerically equal to the area under the velocity curve between the time t1 and t2 and can be calculated by the derivative: a2-a1 = dv / dt.B.…arrow_forwardIn kinematics it may be necessary to analyze a situation in which particles do not exhibit regular displacement throughout their movement, so that we cannot use just a mathematical equation to describe their velocity, acceleration and displacement. In cases like these, we use graphs to represent the motion of a particle, since the fundamental equations of speed and acceleration have geometric relationships with the graphs that represent them. Regarding the graphs of acceleration as a function of time, position as a function of time and speed as a function of time, it can be stated that: Choose one:The. The difference between velocities v2 and v1 is numerically equal to the area under the position curve between time t1 and t2, and therefore can be calculated by the derivative: v2-v1 = dS / dt. The difference between the accelerations a1 and a2 is numerically equal to the area under the velocity curve between the time t1 and t2 and can be calculated by the derivative: a2-a1 = dv /…arrow_forwardA student stands at the edge of a cliff and throws a stone horizontally over the edge with a speed of v0 = 22.0 m/s. The cliff is h = 37.0 m above a flat, horizontal beach as shown in the figure.(d) Write the equations for the position of the stone with time, using the coordinates in the figure. (Use the following as necessary: t. Let the variable t be measured in seconds. Do not state units in your answer.) x = y = (e) How long after being released does the stone strike the beach below the cliff? s(f) With what speed and angle of impact does the stone land? vf = m/s ? = ° below the horizontalarrow_forward
 Physics for Scientists and Engineers: Foundations...PhysicsISBN:9781133939146Author:Katz, Debora M.Publisher:Cengage Learning
 College PhysicsPhysicsISBN:9781305952300Author:Raymond A. Serway, Chris VuillePublisher:Cengage Learning
 College PhysicsPhysicsISBN:9781285737027Author:Raymond A. Serway, Chris VuillePublisher:Cengage Learning