
Videos
Protein Grams in Fast Food The amount of protein (in grams) for a variety of fast-food sandwiches is reported here. Construct a frequency distribution, using 6 classes. Draw a histogram, a frequency
To Sketch: A histogram, frequency polygon and ogive using relative frequency and describe the shape of the histogram for the given data.
Answer to Problem 18E
The sketches of all three graphs are as follows:
The shape of the histogram is right skewed.
Explanation of Solution
Given Info:
The amount of protein (in grams) for a variety of fast-food sandwiches is reported here
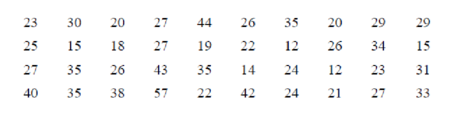
| 23 | 30 | 20 | 27 | 44 | 26 | 35 | 20 | 29 | 29 |
| 25 | 15 | 18 | 27 | 19 | 22 | 12 | 26 | 34 | 15 |
| 27 | 35 | 26 | 43 | 35 | 14 | 24 | 12 | 23 | 31 |
| 40 | 35 | 38 | 57 | 22 | 42 | 24 | 21 | 27 | 33 |
Calculation:
The class boundaries for any class are given by:
The grouped frequency distribution is as follows:
| Class limit | Class boundaries |  Tally Tally |
Frequency |
| 12-19 | 11.5-19.5 |  |
7 |
| 20-27 | 19.5-27.5 |  |
17 |
| 28-35 | 27.5-35.5 | 10 | |
| 36-43 | 35.5-43.5 |
|
4 |
| 44-51 | 43.5-51.5 |
|
1 |
| 52-59 | 51.5-59.5 |
|
1 |
Class midpoint:
The midpoint of class boundaries is obtained by adding lower and upper limit and dividing by 2.
For the first class,
Thus, the midpoint for the first class is 22.
Similarly, the midpoint for other classes was obtained.
Relative frequency distribution:
The relative frequency is the ration of a class frequency to the total frequency. Cumulative relative frequency can also defined as the sum of all previous frequencies up to the current point.
| Class boundaries | Frequency | Mid point |
Relative frequency |
Cumulative relative frequency |
| 11.5-19.5 | 7 | 15.5 | 0.175 | 0.175 |
| 19.5-27.5 | 17 | 23.5 | 0.425 | 0.6 |
| 27.5-35.5 | 10 | 31.5 | 0.25 | 0.85 |
| 35.5-43.5 | 4 | 39.5 | 0.1 | 0.95 |
| 43.5-51.5 | 1 | 47.5 | 0.025 | 0.975 |
| 51.5-59.5 | 1 | 55.5 | 0.025 | 1 |
| Total | 40 |
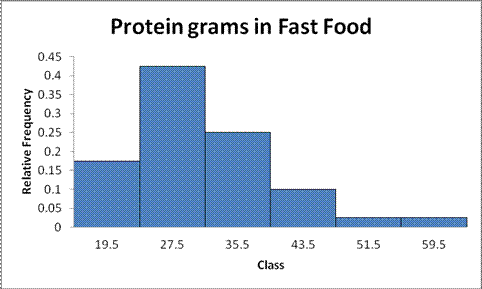
The histogram is a graph that displays the data by using contiguous vertical bars of various heights to represent the frequencies of the classes.
| Upper limit | Relative frequency |
| 19.5 | 0.175 |
| 27.5 | 0.425 |
| 35.5 | 0.25 |
| 43.5 | 0.1 |
| 51.5 | 0.025 |
| 59.5 | 0.025 |
Histogram:
Software procedure:
Step by step procedure for constructing histogram using Excel is given below:
- Press [Ctrl]-N for a new workbook.
- Enter the data in column A, one number per cell.
- Enter the upper boundaries into column B.
- From the toolbar, select the Data tab, then select Data Analysis.
- In Data Analysis, select Histogram and click [OK].
- In the Histogram dialog box, select relative column in the Input Range box and select upper limit column in the Bin Range box.
- Select New Worksheet Ply and Chart Output. Click [OK].
Output obtained from Excel is given below:
Shape of the distribution:
Symmetric:
A distribution is said to be symmetric if the left side of histogram is the mirror image of the right side of histogram.
Skewed right:
If the right side of the distribution extends far away than the left side of histogram, it is said to be skewed right.
Skewed left:
If the left side of the distribution extends far away than the right side of histogram, it is said to be skewed left.
Here, the histogram extends far away than the left side of histogram, it is said to be skewed right.
Hence, the distribution for the amount of protein (in grams) for a variety of fast-food sandwiches is skewed right.
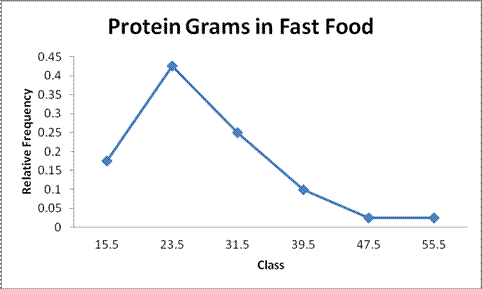
Frequency polygons:
Step by step procedure for constructing frequency polygon using Excel is given below:
- Press [CTRL]-N for a new notebook.
- Enter the midpoints of the data into column A and the frequencies into column B including labels.
- Press and hold the left mouse button, and drag over the Frequencies (including the label) from column B.
- Select the Insert tab from the toolbar and the Line Chart option.
- Select the 2-D line chart type.
Output obtained from Excel is given below:

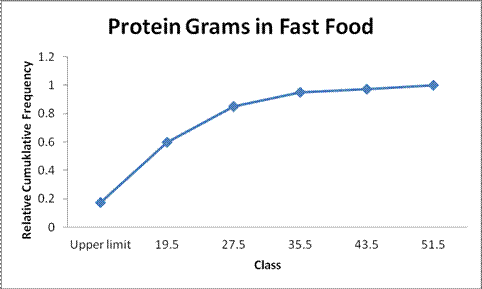
Frequency ogive:
Step by step procedure for constructing frequency ogive using Excel is given below:
- To create an ogive, use the upper class boundaries (horizontal axis) and cumulative frequencies (vertical axis) from the frequency distribution.
- Type the upper class boundaries (including a class with frequency 0 before the lowest class to anchor the graph to the horizontal axis) and
- Corresponding cumulative frequencies into adjacent columns of an Excel worksheet.
- Press and hold the left mouse button, and drag over the Cumulative Frequencies from column B.
- Select Line Chart, then the 2-D Line option.
Output obtained from Excel is given below:

The points plotted are the upper class limit and the corresponding cumulative relative frequency.
Want to see more full solutions like this?
Chapter 2 Solutions
ELEMENTARY STATISTICS W/CONNECT >IP<


 Glencoe Algebra 1, Student Edition, 9780079039897...AlgebraISBN:9780079039897Author:CarterPublisher:McGraw Hill
 Holt Mcdougal Larson Pre-algebra: Student Edition...AlgebraISBN:9780547587776Author:HOLT MCDOUGALPublisher:HOLT MCDOUGAL