
Videos
Applying the Concepts 4–2
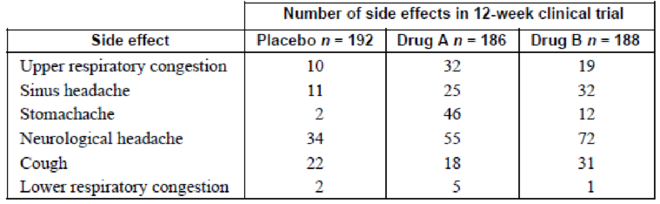
Which Pain Reliever Is Best?
Assume that following an injury you received from playing your favorite sport, you obtain and read information on new pain medications. In that information you read of a study that was conducted to test the side effects of two new pain medications. Use the following table to answer the questions and decide which, if any, of the two new pain medications you will use.
1. How many subjects were in the study?
2. How long was the study?
3. What were the variables under study?
4. What type of variables are they, and what level of measurement are they on?
5. Are the numbers in the table exact figures?
6. What is the
7. What is the probability that a person was receiving a placebo or drug A? Are these mutually exclusive events? What is the complement to this
8. What is the probability that a randomly selected person was receiving a placebo or experienced a neurological headache?
9. What is the probability that a randomly selected person was not receiving a placebo or experienced a sinus headache?
1.
To obtain: The number of objects in the study.
Answer to Problem 1AC
The number of objects in the study is 566.
Explanation of Solution
Given info:
The data set represents the three groups. Those are placebo, Drug A and drug B.
Calculation:
The placebo group contains 192 subjects, group A contains 186 subjects and Group B contains 188 subjects.
The total number of subjects in the given study is
Thus, the total number of subjects in the given study is 566.
2.
To identify: The time duration for the study.
Answer to Problem 1AC
The time duration for the study is 12 weeks.
Explanation of Solution
Justification:
In a clinical trial, the number of side effects for three groups was observed for 12 weeks.
Thus, the time duration for the study is 12 weeks.
3.
To identify: The variables in the study.
Answer to Problem 1AC
The variables in the study are type of pain reliever and the side effects.
Explanation of Solution
Justification:
In the study, the side effects for three groups are observed. That is, the study represents the number of side effects for each group.
Thus, the variables in the study are side effects and pain relievers.
4.
To identify: The type of variables and the level of measurement.
Answer to Problem 1AC
The type of variable is qualitative and the level of measurement is nominal.
Explanation of Solution
Justification:
The variable ‘side effect’ represents 6 categories and ‘pain reliever’ represents 3 groups like placebo, group A and group B. Therefore, the variables in the study represent the qualitative variables. Moreover, the qualitative variables measured on nominal scale.
Thus, the type of variables is qualitative and the level of measurement is nominal.
5.
To observe: Whether the figures in the table or exact or not.
Answer to Problem 1AC
The numbers in the study are exact figures.
Explanation of Solution
Justification:
The numbers in the table represents the number of side effects. Hence, the numbers are exact.
Thus, the numbers in the study are exact figures.
6.
To obtain: The probability of randomly selected person was receiving a placebo.
Answer to Problem 1AC
The probability of randomly selected person was receiving a placebo is 0.339.
Explanation of Solution
Given info:
The table shows the number of side effects in placebo group is 192 and the total number of side effects is 566.
Calculation:
The formula for probability of randomly selected person with placebo is,
Substitute 192 for ‘Number of side effects in placebo’ and 566 for ‘Total number of side effects’,
Thus, the probability of randomly selected person was receiving a placebo is 0.339.
7.
To obtain: The probability of randomly selected person was receiving a placebo or drug A.
To observe: Whether the events are mutually exclusive or not.
To identify: The complement to the event.
Answer to Problem 1AC
The probability of randomly selected person was receiving a placebo or drug A is 0.668.
The events placebo and drug A are mutually exclusive.
The complement for the event is the randomly selected person was receiving drug B.
Explanation of Solution
Given info:
The table shows the number of side effects in placebo group is 192, the number side effects in drug A is 186 and the total number of side effects is 566.
Calculation:
The formula for probability of randomly selected person with drug A is,
Substitute 186 for ‘Number of side effects in drug A’ and 566 for ‘Total number of side effects’,
Addition Rule:
The formula for probability of getting placebo group or drug A is,
Substitute 0.339 for ‘
Thus, the probability of randomly selected person was receiving a placebo or drug A is 0.668.
Justification:
There is intersection part between place and drug A. Hence, the placebo and drug A are mutually exclusive events. The complement event for ‘person receiving the placebo or drug A’ is the randomly selected person was receiving drug B.
Thus, the events placebo and drug A are mutually exclusive and the complement for the event is the randomly selected person was receiving drug B.
8.
To obtain: The probability of randomly selected person was receiving a placebo or experienced a neurological headache.
Answer to Problem 1AC
The probability of randomly selected person was receiving a placebo or experienced a neurological headache is 0.564.
Explanation of Solution
Given info:
The table shows the number of side effects in placebo group is 192, the number side effects in placebo and neurological headache is 34.
Calculation:
The formula for probability of randomly selected person with neurological headache is,
The formula for probability of randomly selected person with placebo and neurological headache is,
Addition Rule for non-mutually exclusive events:
The formula for probability of getting placebo group or neurological headache is,
Substitute 0.339 for ‘
Thus, the probability of randomly selected person was receiving a placebo or experienced a neurological headache is 0.564.
9.
To obtain: The probability of randomly selected person was not receiving a placebo or experienced a sinus headache.
Answer to Problem 1AC
The probability of randomly selected person was not receiving a placebo or experienced a sinus headache is 0.68.
Explanation of Solution
Given info:
The table shows the number of side effects in placebo group is 192, the number side effects in placebo and sinus headache is 11.
Calculation:
The probability of randomly selected person with no placebo is
The formula for probability of randomly selected person with placebo and sinus headache is,
Addition Rule for non-mutually exclusive events:
The formula for probability of getting placebo group or sinus headache is,
Substitute 0.339 for ‘
Thus, the probability of randomly selected person was not receiving a placebo or experienced a sinus headache is0.68.
Want to see more full solutions like this?
Chapter 4 Solutions
Elementary Statistics: A Step By Step Approach


- Use this data for the exercises that follow: In 2013, there were roughly 317 million citizens in the United States, and about 40 million were elderly (aged 65 and over).[34] 60. It is predicted that by 2030, one in five U.S. citizens will be elderly. How much greater will the chances of meeting an elderly person be at that time? What policy changes do you foresee if these statistics hold true?arrow_forwardall spanish words are translated here Hoping to attract more commuters, an urban transportation company plans to run express bus service from a suburban terminal to the city's financial center. These buses should save travel time. The city decides to carry out a study of the effect of four different plans (for example a special lane and synchronized traffic lights) on the travel time of buses. Travel times (in minutes) are measured for multiple business days during peak hour travel when each of the plans is being implemented. The results appear in the table below. Anova: Single Factor The sum of the square of the errors is:arrow_forward1) The question screenshots attached down below. Step-by-Steps solution.arrow_forward
- How profitable are different sectors of the stock market? One way to answer such a question is to examine profit as a percentage of stockholder equity. A random sample of 32 retail stocks such as Toys 'R' Us, Best Buy, and Gap was studied for x1, profit as a percentage of stockholder equity. The result was x1 = 14.0. A random sample of 36 utility (gas and electric) stocks such as Boston Edison, Wisconsin Energy, and Texas Utilities was studied for x2, profit as a percentage of stockholder equity. The result was x2 = 10.3. Assume that ?1 = 4.5 and ?2 = 3.0. (a) Categorize the problem below according to parameter being estimated, proportion p, mean ?, difference of means ?1 – ?2, or difference of proportions p1 – p2. Then solve the problem. p1 – p2?1 – ?2 ?p (b) Let ?1 represent the population mean profit as a percentage of stockholder equity for retail stocks, and let ?2 represent the population mean profit as a percentage of stockholder equity for utility stocks. Find a 99%…arrow_forwardHow profitable are different sectors of the stock market? One way to answer such a question is to examine profit as a percentage of stockholder equity. A random sample of 27 retail stocks such as Toys 'R' Us, Best Buy, and Gap was studied for x1, profit as a percentage of stockholder equity. The result was x1 = 14.4. A random sample of 36 utility (gas and electric) stocks such as Boston Edison, Wisconsin Energy, and Texas Utilities was studied for x2, profit as a percentage of stockholder equity. The result was x2 = 9.7. Assume that σ1 = 3.1 and σ2 = 2.9. (a) Categorize the problem below according to parameter being estimated, proportion p, mean μ, difference of means μ1 – μ2, or difference of proportions p1 – p2. Then solve the problem. pμ p1 – p2μ1 – μ2 (b) Let μ1 represent the population mean profit as a percentage of stockholder equity for retail stocks, and let μ2 represent the population mean profit as a percentage of stockholder equity for utility stocks. Find a 90%…arrow_forwardHow profitable are different sectors of the stock market? One way to answer such a question is to examine profit as a percentage of stockholder equity. A random sample of 27 retail stocks such as Toys 'R' Us, Best Buy, and Gap was studied for x1, profit as a percentage of stockholder equity. The result was x1 = 14.4. A random sample of 36 utility (gas and electric) stocks such as Boston Edison, Wisconsin Energy, and Texas Utilities was studied for x2, profit as a percentage of stockholder equity. The result was x2 = 9.7. Assume that σ1 = 3.1 and σ2 = 2.9. (a) Categorize the problem below according to parameter being estimated, proportion p, mean μ, difference of means μ1 – μ2, or difference of proportions p1 – p2. Then solve the problem. pμ p1 – p2μ1 – μ2 (b) Let μ1 represent the population mean profit as a percentage of stockholder equity for retail stocks, and let μ2 represent the population mean profit as a percentage of stockholder equity for utility stocks. Find a 90%…arrow_forward
- Which model—the one for parliaments or the one for ministries (or cabinets)—presented in the article has the greater explanatory power? How can you tell?arrow_forwardA sample of students attending a large university has been selected. Is there a statistically significant difference between Liberal Arts majors and other students on average number of books (other than those required by course work) read per year? Use the five step model and write a sentence or two interpreting your results. liberal arts X1 = 16.2 s1 = 2.3 N1= 236 Other: x2 = 13.7 s2 =9.0 N2 = 321arrow_forwardThe table below shows the number of deaths in the U.S. in a year due to a variety of causes. For these questions, assume these values are not changing from year to year, and that the population of the United States is 312 million people. Cause Deaths Passenger car occupant 13,100 Motorcycle driver 4,500 Tornado 553 Skydiving 56 h) People sometimes claim motorcycle riding is less dangerous than driving. Does the data support this claim? What additional information and/or calculations would be useful to evaluate this claim?arrow_forward
- McDonald is looking at if their new menu has less calorie than their old menu. Below is the data for 4 menu items. Old Menu New Menu 487 487 329 322 407 405 236 234 A) What is Md? (2.75 is not the correct answer because I tried it and it got me wrong) B) What is SSd? (2.9861 is not the correct answer because I tried it and it got me wrong as well) C) What is Smd? D) What is df? E) What is negative tcrit for an α=0.05? F) What is tobs? G) Do you reject the null?arrow_forwardThe table below shows the number of deaths in the U.S. in a year due to a variety of causes. For these questions, assume these values are not changing from year to year, and that the population of the United States is 312 million people. Cause Deaths Passenger car occupant 14000 Motorcycle driver 4,300 Tornado 553 Skydiving 89 h) People sometimes claim motorcycle riding is less dangerous than car driving. Does the data support this claim? What additional information and/or calculations would be useful to evaluate this claim?arrow_forwardFor which reason is it a problem when journalists only report on one study? a. It can lead people to think journalists are scientists. b. It can cause people to interrogate a study’s validities. c. It can lead people to value one study over decades of previous research. d. It can make journalists look bad.arrow_forward

 Glencoe Algebra 1, Student Edition, 9780079039897...AlgebraISBN:9780079039897Author:CarterPublisher:McGraw Hill
 Big Ideas Math A Bridge To Success Algebra 1: Stu...AlgebraISBN:9781680331141Author:HOUGHTON MIFFLIN HARCOURTPublisher:Houghton Mifflin Harcourt