
Concept explainers
Videos
Fasteners are manufactured for an application involving aircraft. Each fastener is categorized either as conforming (suitable for its intended use), downgraded (unsuitable for its intended use but usable for another purpose), and scrap (not usable). It is thought that 85% of the fasteners are conforming, while 10% are downgraded and 5% are scrap. In a sample of 500 fasteners. 405 were conforming, 55 were downgraded, and 40 were scrap. Can you conclude that the true percentages differ from 85%, 10%, and 5%?
- a. State the appropriate null hypothesis.
- b. Compute the
expected values under the null hypothesis. - c. Compute the value of the chi-square statistic.
- d. Find the P-value. What do you conclude?
a.
State the appropriate null hypothesis.
Explanation of Solution
Given info:
In a sample of 500 fasteners, 405 were conforming, 55 were downgraded, and 40 were scrap. The proportions of fasteners in the three categories are 85%, 10% and 5%.
Justification:
Let
Here, the claim is that the true percentages differ from 85%, 10%, and 5%.
The null hypothesis is,
b.
Compute the expected values under the null hypothesis.
Answer to Problem 1E
The expected value is tabulated below:
| Category | |
| Conforming | |
| Downgraded | |
| scrap | |
Explanation of Solution
Calculation:
The formula for expected value is,
The expected value is calculated as follows:
| Category | Observed value | Proportion | |
| Conforming | 405 | 0.85 | |
| Downgraded | 55 | 0.10 | |
| scrap | 40 | 0.05 | |
| Total = 500 |
c.
Compute the value of the chi-square statistic.
Answer to Problem 1E
The chi square statistic is 10.4412.
Explanation of Solution
Calculation:
The formula for chi square statistic is,
The chi square statistic is calculated as follows:
| Category | Observed value | Expected value | |
| Conforming | 405 | 425 | |
| Downgraded | 55 | 50 | |
| scrap | 40 | 25 | |
| Total = 500 |
From the table, the chi square statistic is 10.4412.
d.
Find the P-value and state the conclusion.
Answer to Problem 1E
The P-value is 0.0054.
There is evidence to conclude that the true percentages differ from 85%, 10%, and 5%.
Explanation of Solution
Calculation:
Degrees of freedom:
P-value:
Software Procedure:
Step-by-step procedure to obtain the P-value using the MINITAB software:
- Choose Graph > Probability Distribution Plot choose View Probability > OK.
- From Distribution, choose ‘Chi square’ distribution.
- In Degrees of freedom, enter 2.
- Click the Shaded Area tab.
- Choose X Value and Right Tail for the region of the curve to shade.
- Enter the data value as 10.4412.
- Click OK.
Output using the MINITAB software is given below:
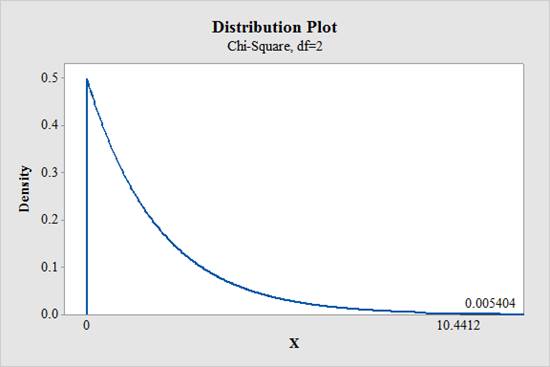
From the MINITAB output, the P-value is 0.0054.
Conclusion:
The P-value is 0.0054 and the significance level is 0.05.
Here, the P-value is less than the significance level.
That is,
Therefore, the null hypothesis is rejected.
Thus, there is evidence to conclude that the true percentages differ from 85%, 10%, and 5%.
Want to see more full solutions like this?
Chapter 6 Solutions
Statistics for Engineers and Scientists
Additional Math Textbook Solutions
An Introduction to Mathematical Statistics and Its Applications (6th Edition)
Elementary Statistics Using The Ti-83/84 Plus Calculator, Books A La Carte Edition (5th Edition)
Business Analytics
Statistics for Business & Economics, Revised (MindTap Course List)
Statistics: The Art and Science of Learning from Data (4th Edition)
APPLIED STAT.IN BUS.+ECONOMICS


 Holt Mcdougal Larson Pre-algebra: Student Edition...AlgebraISBN:9780547587776Author:HOLT MCDOUGALPublisher:HOLT MCDOUGAL