What is a Pure Substance?
A substance with fixed chemical composition throughout is called a pure substance like water, air, and nitrogen. A pure substance does not have to be a single element or compound. A mixture of two or more phases of a pure substance is also a pure substance as long as the chemical composition is the same for all phases. These substances mainly have a constant/ uniform composition. The substances also have fixed boiling and melting points. A pure substance takes part in a chemical reaction to form predictable products.
The common chemical properties and physical properties of pure substances include temperature, pressure, volume, energy, enthalpy, and entropy, mass, density, specific volume. These properties can be extensive (depends on the amount) or intensive (independent of the amount). Extensive properties - mass, weight, and volume. Intensive properties- color, electrical conductivity, melting point, boiling point, and physical state, at a given temperature.
Phases of a Pure Substance
A pure substance exists in two or more phases. There are three principal phases, namely solid, liquid, and gas.
Phase: It is defined as having a distinct molecular arrangement that is homogenous throughout and separated from others (if any), by easily identifiable boundary surfaces. A substance may have several phases within a principal phase, each with a separate molecular structure. Carbon may exist in nature as graphite or diamond in the solid phase, while ice exists in seven different phases at high pressure. Molecular bond strength is high in solids and the weakest in gases.
Solid: The molecules in a solid, are arranged in a three‐dimensional pattern (lattice) throughout the solid. The molecules cannot move relative to each other but oscillate about their equilibrium position, continuously.
Liquid: The molecular spacing in the liquid phase is not very different from the solid phase (generally slightly higher), except the molecules are no longer at a fixed position relative to each other.
Gas: The molecules are driven far apart from each other, and a molecular order does not exist in a gaseous state. Gas molecules move randomly and collide with each other, as well as the walls of the container they occupy.
Saturation Temperature and Saturation Pressure:
- The temperature at which phase change occurs, at a particular pressure, is called Tsat(saturation temperature).
- The pressure at which phase change occurs, at a particular temperature, is called Psat(saturation pressure).
Features of Pure Substances
- It would be the same throughout.
- It is a homogeneous mixture of various chemical elements /compounds that can also be considered as a pure substance (uniform chemical composition).
The Behavior of Pure Substances (Phase Change Processes)
- All pure substances exhibit the same general behavior, the exception being that most contract on freezing. H2O (and others) expand on freezing.
- Phase change processes:
Critical point: It is the point at which the liquid and vapor phases are not distinguishable
Triple point: It is the point at which the liquid, solid, and vapor phases can exist together
The P‐T or Phase Change Diagram
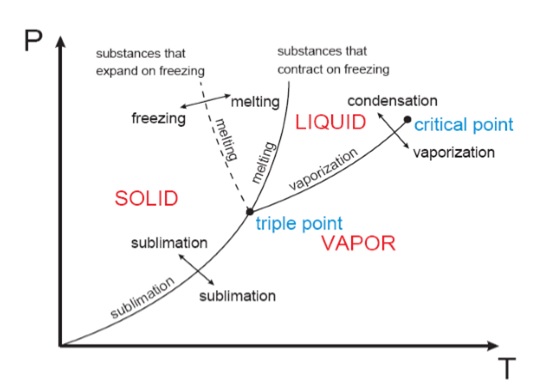
This is called a phase diagram. The three phases are separated from each other by three lines. Most pure substances exhibit this same behavior. An exception is the case of water, which expands upon freezing. The state of the chemical substance is the condition of the substance as described by its properties. If we heat water, we can say its state has changed because its temperature has changed. There are different ways to determine the value of the other properties.
There are two ways that a substance can transform from the solid phase to vapor
i) It melts first to a liquid and subsequently evaporates
ii) It evaporates directly without melting (sublimation).
The sublimation line and vaporization line acts as seperation lines. These three lines meet at the triple point.
iii) Normally the substance melts into a liquid and then evaporates. But matter (like CO2) which has a triple point above 1 atm, sublimates under atmospheric conditions (dry ice).
The four variables are Pressure, Temperature, Specific volume and quality. The phase of the substance is determined first. Once we know the phase, we can decide which table (compressed liquid, saturated liquid, super-heated vapor or ideal gas) to use.
The slope of the solid/liquid equilibrium line for water on a pressure-temperature graph has a large negative slope. This means liquid water under high pressure will freeze at a slightly lower temperature than water, under lower pressure. (Most other substances contract upon freezing and the slope of the solid/liquid boundary is positive.)
The heating of compressed liquid water at constant pressure (lower than the critical pressure) will first result in a saturated liquid, then in a two-phase mixture, and finally in a saturated vapor, and then in a super-heated vapor. The P-V phase diagram of water is shown.
Real Gases
Gas behavior that does not follow closely the ideal gas equation behavior, is known as real gases. To find the relationship between different properties, we attempt to produce a state equation, such as Van der Waals equation. These equations require time-consuming calculations, to evaluate fluid properties. Another simpler approach that is less accurate uses the fact that the shape of the P - V - T diagram is similar for most pure substances when their properties are scaled by the critical point values.
The Principle of Corresponding States
When reducing all P - V - T surfaces to a common scale based on their critical characteristic property, the sealed points on these surfaces should be in corresponding states.
So we can map properties from a known P - V - T surface onto an unknown one. This idea works well in the vapor-gas region but does not adequately represent the two-phase and liquid areas on the P- V - T surfaces.
P-V Diagram

Whenever the temperature and specific volume are mentioned, the phase must first be determined by comparing the specified volume to the specific volume of the saturated liquid and the specific volume of the saturated vapor at the specified temperature, by plotting the state on a T−V diagram.
Phase Change, Property Tables and Diagrams
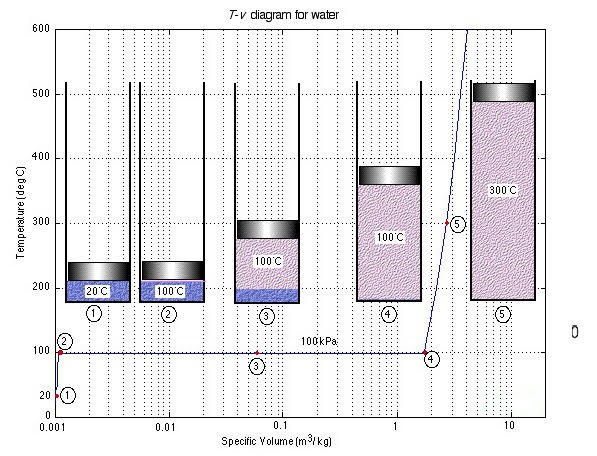
Let us consider the characteristic property values and relationships of a pure substance (such as water) which can exist in three phases, i.e., solid, liquid and gas. We will not consider the solid-state. To introduce the complex phase change interactions that occur in pure substances, we will consider an experiment in which we have liquid water in a piston-cylinder device at 20°C and 100kPa pressure. Heat is added to the cylinder, while the pressure is maintained constant until the temperature reaches 300°C, as shown in the T-V diagram (temperature vs specific volume):
Property Tables
For most substances, the relationship among thermodynamic properties is too complex to be expressed by simple equations, which is the reason properties are frequently presented in the form of tables.
T-V Diagram

From State (1) to State (2) the water maintains its liquid phase and the specific volume increases very slightly until the temperature reaches close to 100°C (State (2) - Saturated Liquid).
As more heat is added the water progressively changes its phase from liquid to water vapor (steam) while the temperature is maintained at 100°C (Saturation Temperature - Tsat) until there is no liquid remaining in the cylinder (State (4) - Saturated Vapor).
When further heat is applied the water vapor temperature increases (T >Tsat) and is said to be Superheated (State (5)).
Notice that during this entire process the specific volume of the water increased by more than three orders of magnitude, making it necessary to use a logarithmic scale for the specific volume axis.
Enthalpy: It is a property defined as H = U + PV (kJ). Enthalpy of vaporization (or latent heat): It is the amount of internal energy needed to vaporize a unit mass of saturated liquid at a given temperature or pressure. Enthalpy decreases as the temperature or pressure increases and becomes zero at the critical point.
Quality Region
The Quality Region is referred to as Saturated Liquid-Vapor Mixture Region. It is the area in the graph enclosed between the saturated liquid line and the saturated vapor line. At any point within this region. The quality of the mixture (referred to as the dryness factor). It is defined as the mass of vapor divided by the total mass of the fluid.
T-V Diagram

The saturation lines define the regions of interest as shown in the diagram, being the Compressed Liquid region, the Quality region enclosed by the saturation lines and the Superheat region (which also includes the Tran critical region) to the right of the saturated vapor line and above the critical point. Property Tables associated with the regions are used to evaluate the various properties.

Common Mistakes
- Error in the saturation lines defining the regions of interest
- Error in plotting data points of Pressure–Temperature phase diagram
- Error in plotting data points of Volume –Temperature phase diagram
- Thermodynamic instabilities in the system.
Context and Application
- Bachelor in Science Chemistry
- Chemical and Mechanical engineering
Related concepts
- Phase Change Diagram
- Element
- Compound
- State
- Triple point
- Thermodynamics
Want more help with your mechanical engineering homework?
*Response times may vary by subject and question complexity. Median response time is 34 minutes for paid subscribers and may be longer for promotional offers.
Search. Solve. Succeed!
Study smarter access to millions of step-by step textbook solutions, our Q&A library, and AI powered Math Solver. Plus, you get 30 questions to ask an expert each month.
Properties of Pure Substances Homework Questions from Fellow Students
Browse our recently answered Properties of Pure Substances homework questions.
Search. Solve. Succeed!
Study smarter access to millions of step-by step textbook solutions, our Q&A library, and AI powered Math Solver. Plus, you get 30 questions to ask an expert each month.