What is Maxwell speed distribution?
Maxwell-Boltzmann distribution or commonly known as Maxwell speed distribution, explains the division of the energy levels of the molecules of an ideal gas on the basis of the statistical theory. In 1859, Scottish physicist James Clerk Maxwell established the context for the distribution of molecular velocities for random molecules moving in a closed environment. This theory was generalized in 1871 by German physicist Ludwig Boltzmann. He improvised the theory to express the distribution of energy levels among different molecules.
Graph representing Maxwell speed distribution
The function that Boltzmann used to prove the theory is called the Maxwell-Boltzmann (MB) velocity distribution function. It explains how the speeds of certain molecules are distributed in the case of an ideal gas. The graphical representation of Maxwell speed distribution for ideal gases is shown below.
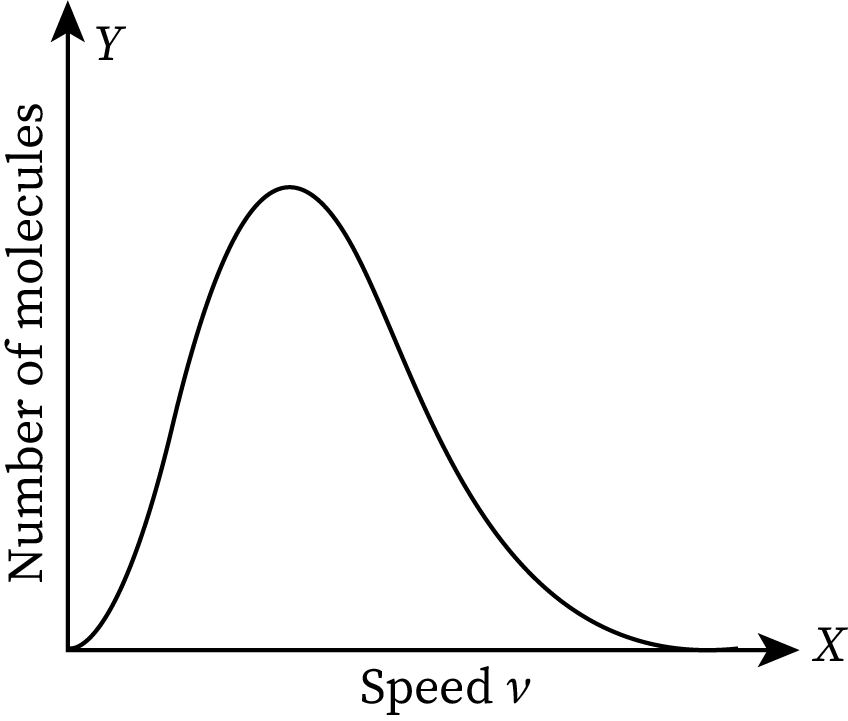
In the graph, the speed of the molecules is marked along the X-axis and the number of molecules per unit speed is marked along the Y-axis. If the graph is larger in a region, the number of molecules moving with a speed corresponding to that particular region is higher. The given graph is asymmetrical. It has a long tail in the high-speed area (extreme right of the graph). The extreme left value of the graph is zero. It means the molecules of the ideal gas do not have a speed less than zero.
The maximum speed in the Maxwell-Boltzmann distribution plot is termed the most probable speed.
Maxwell- Boltzmann distribution formula
Maxwell-Boltzmann velocity distribution function is a probability function that depends on the velocity of the moving particles. It is represented as f(c). This distribution function for a gas, represented in terms of the total energy of molecules in the system, also depends on the absolute temperature, Boltzmann constant. The equation for this Maxwell-Boltzmann velocity distribution function is:
Here, v is the speed, m is the mass of the molecule, is the Boltzmann constant, T is the absolute temperature.
Maxwell speed distribution or Maxwell-Boltzmann distribution is used for particles or molecules. It describes the probability distribution of molecules at various speeds within a stationary container or a closed system at a specific temperature.
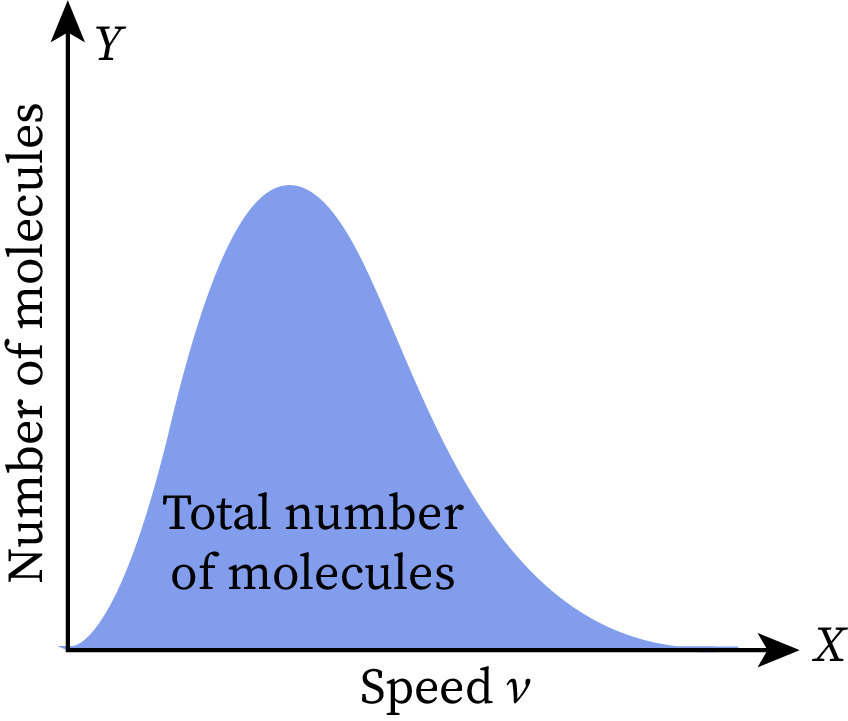
What does the area under Maxwell speed distribution curve represents?
The Y-axis of the Maxwell-Boltzmann distribution graph depicts the number of ideal gas molecules per unit velocity. Thus, the area under the curve gives the total number of molecules present in the gas.
Change in area of graph with respect to temperature
The given Maxwell-Boltzmann distribution graph is set at room temperature. When we increase or decrease the temperature of this gas, the shape of the graph changes without affecting its total area. As the total area represents the total number of molecules in the given ideal gas, it does not vary with temperature.
Suppose the temperature of the gas becomes more than the room temperature. Then the average speed of gas molecules in the system will increase, and the peak of the graph will shift toward the right end. The area under the graph must be constant at all temperatures, so the height of the graph will decrease to maintain the constant area. This part of the graph is shown in the figure with a green-colored area.
Similarly, when the temperature of the given gas becomes lower than the room temperature, the average speed of molecules decreases. As a result, the peak of the MB distribution curve shifts towards the left side of the graph. For keeping the total numbers of molecules in the system (area under the graph) constant, the height of the graph increases. This part of the graph is shown in the figure with a yellow-colored area.
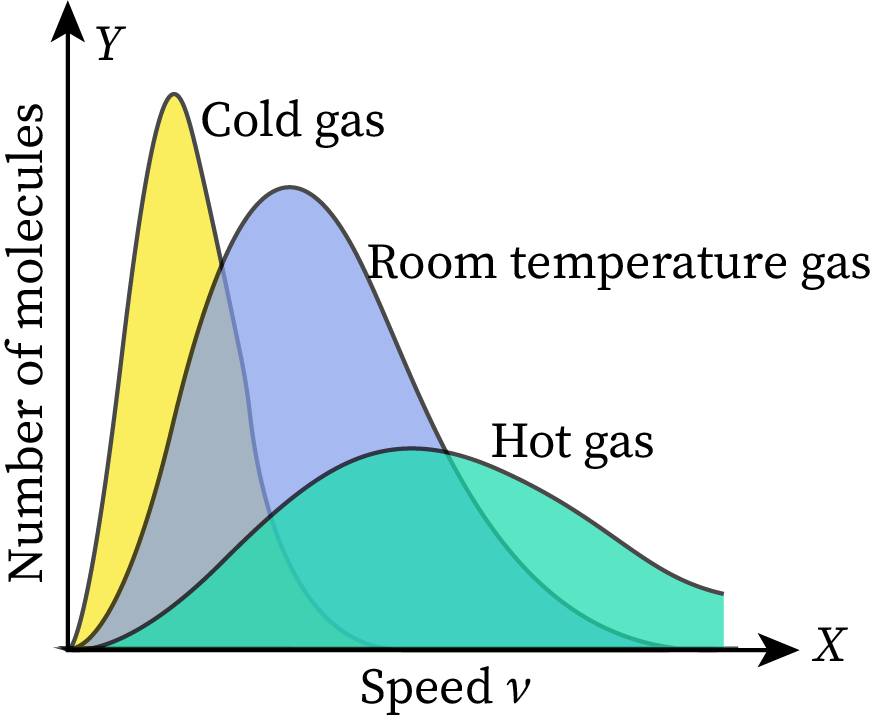
In conclusion, the graph becomes narrow when the temperature of the system decreases, and it becomes wide when the temperature of the system increases. Also, the area under the MB distribution graph represents the total number of particles in the given system. Therefore, the area of the graph changes with reference to the number of particles.
Root mean square velocity
As the name suggests, the root mean square (rms) velocity (or speed) is the square root of the mean value of the velocity square of a given distribution. Here, the ideal gas is treated as a system. The equation for the root mean square velocity of molecules having velocities etc., is represented as:
Where, n is the total number of particles.
Velocity is a vector quantity. Taking the mean value, the negative and positive velocities (of particles moving in opposite directions) cancel each other, and the exact value is not obtained. To avoid this, first square all values of velocity and make them positive. Then take the mean and the root of the mean. This is the advantage of rms velocity over average or mean velocity.
Average speed and most probable speed
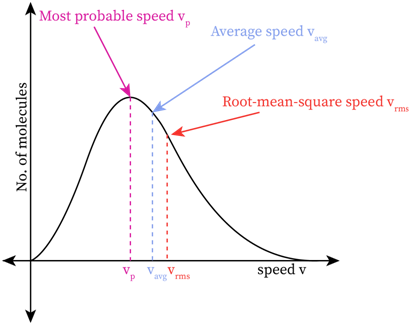
The peak speed or the speed at the top of the Maxwell-Boltzmann distribution curve is called the most probable speed. This value of speed has the maximum probability of being satisfied by a large number of molecules present in the system. In other words, the probable density of the molecules in this area is high.
The average speed of molecules in a given system is calculated by dividing the total speed of the molecules by the total number of molecules. This value is located at the right side of the most probable speed. The longer tail on the right end of the graph is visible in the high-velocity region. The large number of molecules in this long tail region pull the average speed a bit right to the peak point.
Common Mistakes
Most of the students get confused between the three regions of speed-probable speed, average speed, and root mean square speed. The most probable speed is the peak value of the curve where there is high probability of finding molecules with this speed. The root mean square speed is the square root of the mean value of speed squares of a given distribution.
Students also sometimes make mistakes in determining the change in the area of a graph with respect to temperature. The graph becomes narrow when the temperature decreases and becomes wider when the temperature increases.
Context and application
This topic is significant for professional exams for undergraduate and postgraduate courses, especially for,
- Bachelor of Science in Physics
- Bachelor of Technology in Chemical Engineering
- Bachelor of Science in Chemistry
- Bachelor of Science in Atmospheric Science
- Master of Science in Physics
- Master of Science in Chemistry
Related Concepts
- Ideal gas
- Density of states
- Temperature velocity relationship
- Helmholtz equation
- Effect of radiations
- Thermodynamics
- Entropy
- Probability density
- Subatomic particles
- Particle and wave nature
Practice Questions
Q1: The root mean square speed of the gas molecules is V. If the pressure of the gas molecules is tripled, temperature remaining constant, the root mean square speed will become
- 6V
- 3V
- V
- 2V
Correct option: (c)
Explanation: The root mean square speed doesn't rely on the pressure of the gas molecule, so the change in pressure doesn't affect the speed, and it will remain the same.
Q2: What does the area under the Maxwell-Boltzmann distribution curve represent?
- Total number of molecules
- Total acceleration of the molecules
- Total speed of the molecules
- Total number of molecules per unit acceleration
Correct option: (a)
Explanation: The Maxwell-Boltzmann distribution curve expresses the allocation of the speed of gas particles at a particular temperature. The area under the Maxwell-Boltzmann distribution curve indicates the total number of molecules.
Q3: Maxwell-Boltzmann law is applicable to
- Particles with half-integral spin
- Distinguishable particles
- Particles with an integral spin
- Indistinguishable particles
Correct option: (b)
Explanation: The Maxwell-Boltzmann law is not appropriate for the particles having integral spin or half-integral spin. It describes the distribution of energy between the particles. So, it is applicable for distinguishable particles.
Q4: If the mass of gas A is 9 times the mass of gas B at the same temperature T, what is the ratio of the mean velocity of A to the mean velocity of B?
- 2:1
- 1:2
- 3:1
- 1:3
Correct option: (d)
Explanation: The mean velocity of the gas molecule is inversely related to the square root of the mass of gas. The mass of gas A is 9 times the mass of gas B, which means that gas A's mean velocity will be less than the mean velocity of gas B. The square root of 9 will be 3, so on calculating further, it is concluded that the mean velocity ratio will be 1:3.
Q5: The average linear kinetic energy per unit molecules of any gas per unit degree of freedom is ___________.
Correct option: (a)
Explanation: The average linear kinetic energy relies on the Boltzmann constant (K) and temperature (T). The relation of average kinetic energy per unit molecule of a certain gas will be .
Want more help with your physics homework?
*Response times may vary by subject and question complexity. Median response time is 34 minutes for paid subscribers and may be longer for promotional offers.
Maxwell speed distribution Homework Questions from Fellow Students
Browse our recently answered Maxwell speed distribution homework questions.