01:17:42 The ages of the 5 officers for a school club are 18, 18, 17, 16, and 15. The range of the distribution of ages is 3. The table displays all possible samples of size 2 and the corresponding ranges for each sample. Sample n = 2 Sample Range 18, 18 0 18, 17 1 18, 15 18, 17 1 18, 16 2 17, 16 18, 16 2 17, 15 ^ 18, 15 3 3 16, 1 1 2 Using the values in the table, is the sample range an unbiased estimator? Yes, 3 is the maximum of the sample ranges. Yes, the range of the sampling distribution of the sample range is 3. No, 80% of the possible values of the range of the samples is less than 3. No, the mean of the sampling distribution of the sample ranges is 1.6, which is not 3. Unmark this question Save and Exit Next entViewers/AssessmentViewer/Activit Submit
01:17:42 The ages of the 5 officers for a school club are 18, 18, 17, 16, and 15. The range of the distribution of ages is 3. The table displays all possible samples of size 2 and the corresponding ranges for each sample. Sample n = 2 Sample Range 18, 18 0 18, 17 1 18, 15 18, 17 1 18, 16 2 17, 16 18, 16 2 17, 15 ^ 18, 15 3 3 16, 1 1 2 Using the values in the table, is the sample range an unbiased estimator? Yes, 3 is the maximum of the sample ranges. Yes, the range of the sampling distribution of the sample range is 3. No, 80% of the possible values of the range of the samples is less than 3. No, the mean of the sampling distribution of the sample ranges is 1.6, which is not 3. Unmark this question Save and Exit Next entViewers/AssessmentViewer/Activit Submit

Elementary Linear Algebra (MindTap Course List)
8th Edition
ISBN:9781305658004
Author:Ron Larson
Publisher:Ron Larson
Chapter2: Matrices
Section2.5: Markov Chain
Problem 36E: Customer Preference Two movie theatres that show several different movies each night compete for the...

Related questions
Question
Help plz
Transcribed Image Text:X CR-RISD-Statistics B-21-22-Edge X +
earn.edgenuity.com/player/
♡♡
D-M...
Classroom
Focus/SIS-RISD-F...
One Categorical Va... SLET 3 SLET 3 NOTEBOOK
Cadet Refrence V6 JUMS
Cumulative Exam
Cumulative Exam
Active
C
5
7
▸
TIME REMAINING
01:17:42
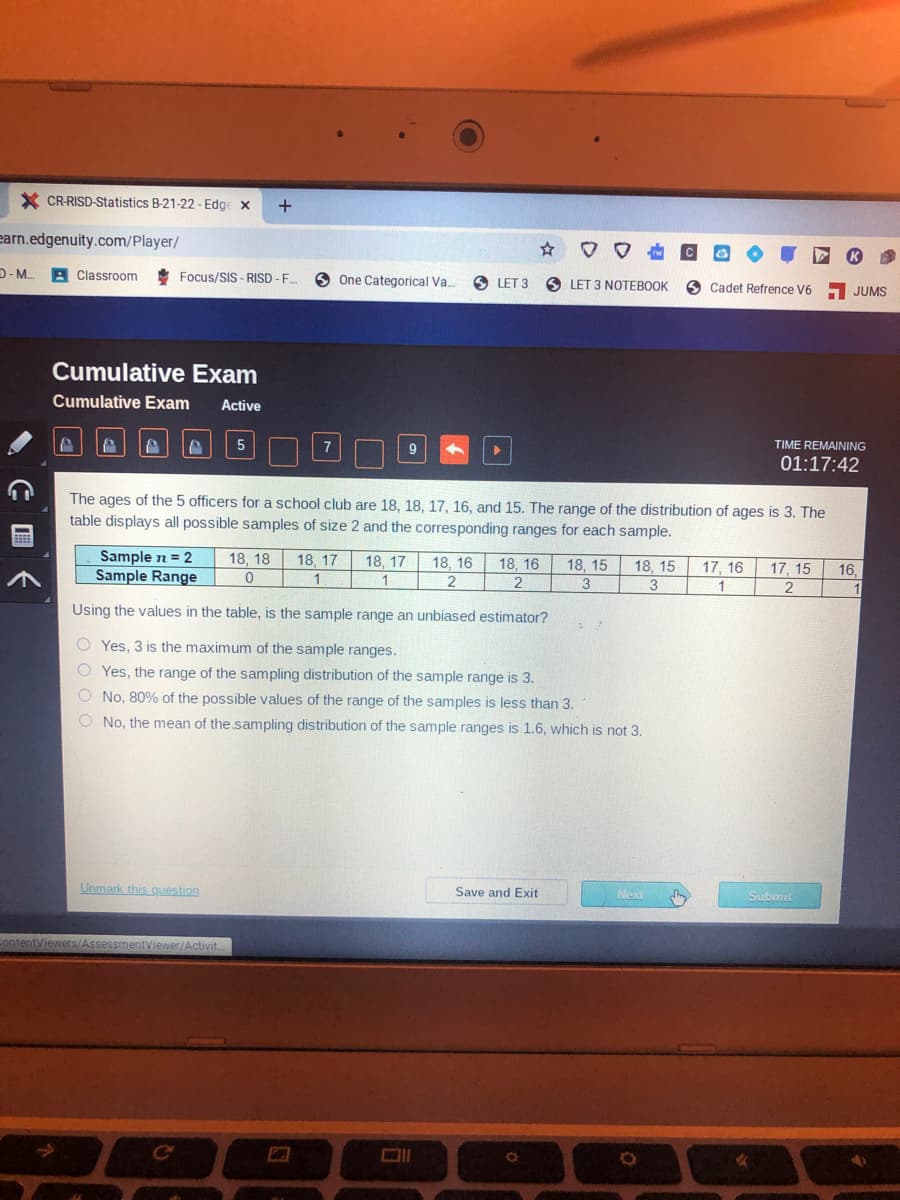
The ages of the 5 officers for a school club are 18, 18, 17, 16, and 15. The range of the distribution of ages is 3. The
table displays all possible samples of size 2 and the corresponding ranges for each sample.
B
18, 15
Sample n = 2 18, 18
Sample Range 0
18, 17
1
18, 17
1
18, 16
2
18, 16
2
18, 15
3
17, 16 17, 15
1
16,
1
3
2
Using the values in the table, is the sample range an unbiased estimator?
1
2
OYes, 3 is the maximum of the sample ranges.
O Yes, the range of the sampling distribution of the sample range is 3.
O No, 80% of the possible values of the range of the samples is less than 3.
O No, the mean of the sampling distribution of the sample ranges is 1.6, which is not 3.
Unmark this question
Save and Exit
Next
ContentViewers/AssessmentViewer/Activit
O
Sh
Submit
Expert Solution
This question has been solved!
Explore an expertly crafted, step-by-step solution for a thorough understanding of key concepts.

This is a popular solution!

Trending now
This is a popular solution!

Step by step
Solved in 2 steps with 2 images

Recommended textbooks for you
Elementary Linear Algebra (MindTap Course List)
Algebra
ISBN:
9781305658004
Author:
Ron Larson
Publisher:
Cengage Learning

Algebra & Trigonometry with Analytic Geometry
Algebra
ISBN:
9781133382119
Author:
Swokowski
Publisher:
Cengage
Elementary Linear Algebra (MindTap Course List)
Algebra
ISBN:
9781305658004
Author:
Ron Larson
Publisher:
Cengage Learning
Algebra & Trigonometry with Analytic Geometry
Algebra
ISBN:
9781133382119
Author:
Swokowski
Publisher:
Cengage