05. Suppose we wish to study the relationship between religious affiliation and geographical region. Two groups of people are chosen at random, one from the east coast and one from the- west coast of the United States and each person is classified as Protestant, Catholic, or Jewish. The observed frequencies are presented in the following table. Protestant Catholic Jewish East coast West coast 215 136 182 203 154 110 Test to see if religious faith is independent of the region where one lives. For this test, specify the null and the alternate hypotheses that are being tested, report the X² test statistic and the critical value you are using to conduct the test, and clearly state the conclusion of the test in the context of the problem (use =0.05). Show your work.
05. Suppose we wish to study the relationship between religious affiliation and geographical region. Two groups of people are chosen at random, one from the east coast and one from the- west coast of the United States and each person is classified as Protestant, Catholic, or Jewish. The observed frequencies are presented in the following table. Protestant Catholic Jewish East coast West coast 215 136 182 203 154 110 Test to see if religious faith is independent of the region where one lives. For this test, specify the null and the alternate hypotheses that are being tested, report the X² test statistic and the critical value you are using to conduct the test, and clearly state the conclusion of the test in the context of the problem (use =0.05). Show your work.

MATLAB: An Introduction with Applications
6th Edition
ISBN:9781119256830
Author:Amos Gilat
Publisher:Amos Gilat
Chapter1: Starting With Matlab
Section: Chapter Questions
Problem 1P

Related questions
Topic Video
Question
A question in applied statistics
I want a fast solution
Transcribed Image Text:KINGDOM OF SAUDI ARABIA Bb
o https://Ims,.jazanu.edu.sa/bbcswebdav/pid-791577-dt-content-rid-224296171/courses/453STAT-
= الأخبار علامات التبويب من ۱۶. . .
تمي بز
A قراءة بصوت عال
کا عرض الصفحة
ميا
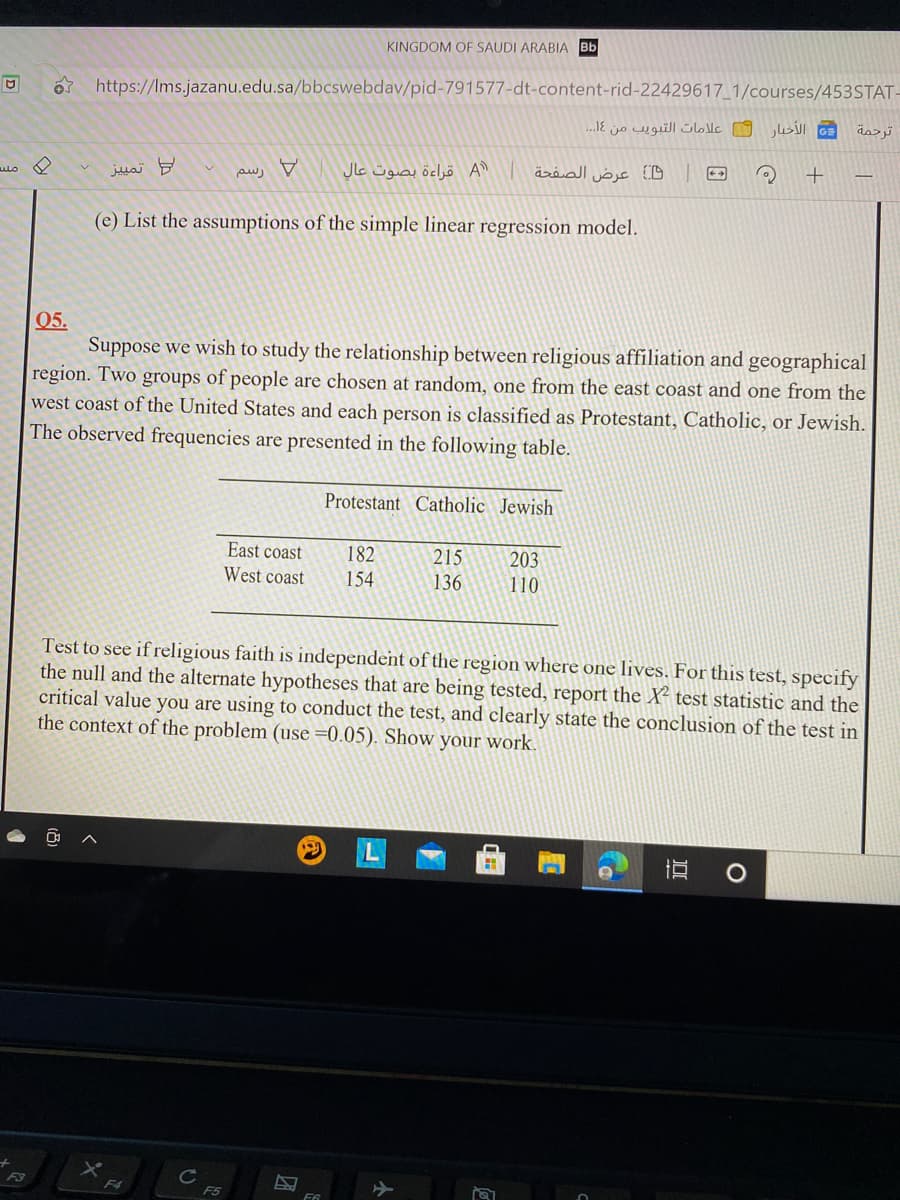
(e) List the assumptions of the simple linear regression model.
Q5.
Suppose we wish to study the relationship between religious affiliation and geographical
region. Two groups of people are chosen at random, one from the east coast and one from the
west coast of the United States and each person is classified as Protestant, Catholic, or Jewish.
The observed frequencies are presented in the following table.
Protestant Catholic Jewish
East coast
West coast
182
215
203
154
136
110
Test to see if religious faith is independent of the region where one lives. For this test, specify
the null and the alternate hypotheses that are being tested, report the X² test statistic and the
critical value you are using to conduct the test, and clearly state the conclusion of the test in
the context of the problem (use =0.05). Show your work.
直
F3
F4
F5
Expert Solution
This question has been solved!
Explore an expertly crafted, step-by-step solution for a thorough understanding of key concepts.

This is a popular solution!

Trending now
This is a popular solution!

Step by step
Solved in 4 steps

Knowledge Booster


Learn more about
Need a deep-dive on the concept behind this application? Look no further. Learn more about this topic, statistics and related others by exploring similar questions and additional content below.Recommended textbooks for you
MATLAB: An Introduction with Applications
Statistics
ISBN:
9781119256830
Author:
Amos Gilat
Publisher:
John Wiley & Sons Inc

Probability and Statistics for Engineering and th…
Statistics
ISBN:
9781305251809
Author:
Jay L. Devore
Publisher:
Cengage Learning

Statistics for The Behavioral Sciences (MindTap C…
Statistics
ISBN:
9781305504912
Author:
Frederick J Gravetter, Larry B. Wallnau
Publisher:
Cengage Learning
MATLAB: An Introduction with Applications
Statistics
ISBN:
9781119256830
Author:
Amos Gilat
Publisher:
John Wiley & Sons Inc
Probability and Statistics for Engineering and th…
Statistics
ISBN:
9781305251809
Author:
Jay L. Devore
Publisher:
Cengage Learning
Statistics for The Behavioral Sciences (MindTap C…
Statistics
ISBN:
9781305504912
Author:
Frederick J Gravetter, Larry B. Wallnau
Publisher:
Cengage Learning

Elementary Statistics: Picturing the World (7th E…
Statistics
ISBN:
9780134683416
Author:
Ron Larson, Betsy Farber
Publisher:
PEARSON

The Basic Practice of Statistics
Statistics
ISBN:
9781319042578
Author:
David S. Moore, William I. Notz, Michael A. Fligner
Publisher:
W. H. Freeman

Introduction to the Practice of Statistics
Statistics
ISBN:
9781319013387
Author:
David S. Moore, George P. McCabe, Bruce A. Craig
Publisher:
W. H. Freeman