1 0.87 Office 0.95 Office 1.1 Office 1.1 School 1.13 Office 0.95 Hospital 0.87 Office 1.05 Hospital 1.13 Garage 1 Office 1.16 School 1.16 School 0.95 Hospital 1 Hospital 1.13 Hospital 2000 18 1 1 4 2014 1.2 4 2000 8. 1 9 2000 11 1 8 2002 0.5 6 1999 14 1 8 2007 3 1 6 1998 4 1 2 1998 21 1 2001 4 4 1 1 2000 2002 1 4 1.1 4 7 4 1.45 2015 1 3 2000 7 4 1.15 2 1999 3 3 1.1 423 24
1 0.87 Office 0.95 Office 1.1 Office 1.1 School 1.13 Office 0.95 Hospital 0.87 Office 1.05 Hospital 1.13 Garage 1 Office 1.16 School 1.16 School 0.95 Hospital 1 Hospital 1.13 Hospital 2000 18 1 1 4 2014 1.2 4 2000 8. 1 9 2000 11 1 8 2002 0.5 6 1999 14 1 8 2007 3 1 6 1998 4 1 2 1998 21 1 2001 4 4 1 1 2000 2002 1 4 1.1 4 7 4 1.45 2015 1 3 2000 7 4 1.15 2 1999 3 3 1.1 423 24

Big Ideas Math A Bridge To Success Algebra 1: Student Edition 2015
1st Edition
ISBN:9781680331141
Author:HOUGHTON MIFFLIN HARCOURT
Publisher:HOUGHTON MIFFLIN HARCOURT
Chapter11: Data Analysis And Displays
Section11.4: Two-ways Tables
Problem 28E

Related questions
Topic Video
Question
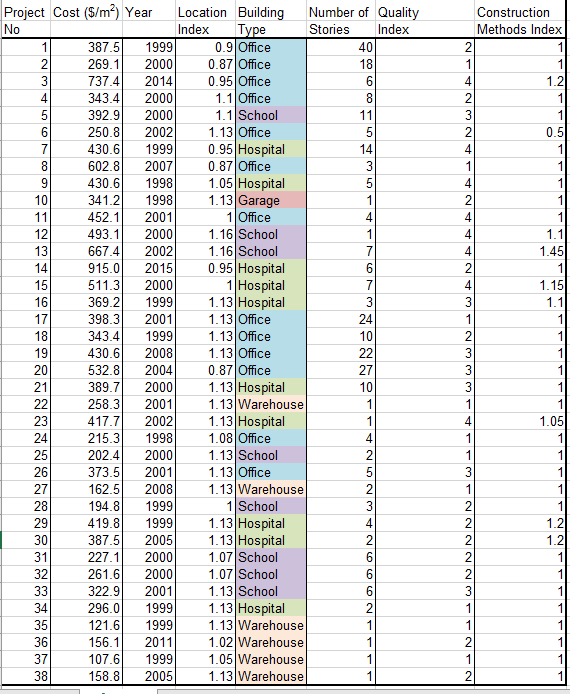
Transcribed Image Text:Project Cost (S/m?) Year
Location Building
Number of Quality
Construction
No
Index
Methods Index
Туре
0.9 Office
0.87 Office
0.95 Office
Stories
Index
1
387.5
1999
40
2
2
269.1
2000
18
1
1
3
737.4
2014
6
4.
1.2
1.1 Office
1.1 School
1.13 Office
0.95 Hospital
0.87 Office
1.05 Hospital
1.13 Garage
1Office
4
343.4
2000
8
2
5
392.9
2000
11
3
1
250.8
2002
2
0.5
7
430.6
1999
14
4
8
602.8
2007
3
1
9
430.6
1998
4
10
341.2
1998
1
11
452.1
2001
4.
4
1
12
493.1
2000
1.16 School
1
4
1.1
13
667.4
2002
1.16 School
7
4
1.45
0.95 Hospital
1 Hospital
1.13 Hospital
1.13 Office
14
915.0
2015
6
15
511.3
2000
7
4
1.15
16
369.2
1999
3
1.1
17
398.3
2001
24
1.13 Office
1.13 Office
18
343.4
1999
10
2
19
430.6
2008
22
3
1
20
532.8
2004
0.87 Office
27
1.13 Hospital
1.13 Warehouse
1.13 Hospital
1.08 Office
21
389.7
2000
10
3
22
258.3
2001
1
23
417.7
2002
1
4
1.05
24
215.3
1998
1
25
202.4
2000
1.13 School
1
1
1.13 Office
1.13 Warehouse
1 School
1.13 Hospital
1.13 Hospital
1.07 School
1.07 School
1.13 School
1.13 Hospital
1.13 Warehouse
1.02 Warehouse
1.05 Warehouse
1.13 Warehouse
26
373.5
2001
3
27
162.5
2008
2
1
28
194.8
1999
3
29
419.8
1999
1.2
30
387.5
2005
2
1.2
31
227.1
2000
2
261.6
322.9
296.0
32
2000
6
2
33
2001
3
1
34
1999
2
1
35
121.6
1999
1
36
156.1
2011
1
37
107.6
1999
1
38
158.8
2005
1
1
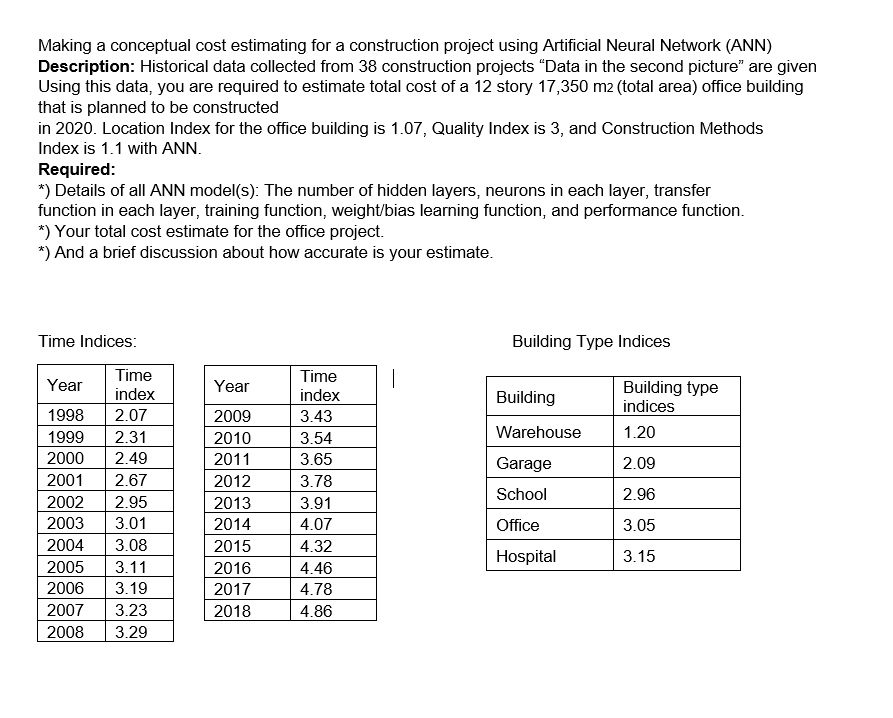
Transcribed Image Text:Making a conceptual cost estimating for a construction project using Artificial Neural Network (ANN)
Description: Historical data collected from 38 construction projects "Data in the second picture" are given
Using this data, you are required to estimate total cost of a 12 story 17,350 m2 (total area) office building
that is planned to be constructed
in 2020. Location Index for the office building is 1.07, Quality Index is 3, and Construction Methods
Index is 1.1 with ANN.
Required:
*) Details of all ANN model(s): The number of hidden layers, neurons in each layer, transfer
function in each layer, training function, weight/bias learning function, and performance function.
*) Your total cost estimate for the office project.
*) And a brief discussion about how accurate is your estimate.
Time Indices:
Building Type Indices
Time
Time
Year
Year
Building type
index
index
Building
indices
1998
2.07
2009
3.43
1999
2.31
2010
3.54
Warehouse
1.20
2000
2.49
2011
3.65
Garage
2.09
2001
2.67
2012
3.78
School
2.96
2002
2.95
2013
3.91
2003
3.01
2014
4.07
Office
3.05
2004
3.08
2015
4.32
Hospital
3.15
2005
3.11
2016
4.46
2006
3.19
2017
4.78
2007
3.23
2018
4.86
2008
3.29
Expert Solution
This question has been solved!
Explore an expertly crafted, step-by-step solution for a thorough understanding of key concepts.

Step by step
Solved in 2 steps

Knowledge Booster


Learn more about
Need a deep-dive on the concept behind this application? Look no further. Learn more about this topic, statistics and related others by exploring similar questions and additional content below.Recommended textbooks for you
Big Ideas Math A Bridge To Success Algebra 1: Stu…
Algebra
ISBN:
9781680331141
Author:
HOUGHTON MIFFLIN HARCOURT
Publisher:
Houghton Mifflin Harcourt
Big Ideas Math A Bridge To Success Algebra 1: Stu…
Algebra
ISBN:
9781680331141
Author:
HOUGHTON MIFFLIN HARCOURT
Publisher:
Houghton Mifflin Harcourt