3.24 An article in the ACI Materials Journal (Vol. 84, 1987, pp. 213–216) describes several experiments investigating the rodding of concrete to remove entrapped air. A 3-inch × 6-inch cylinder was used, and the number of times this rod was used is the design variable. The resulting compressive strength of the concrete specimen is the response. The data are shown in the following table: Rodding Level Compressive Strength 10 1530 1530 1440 15 1610 1650 1500 20 1560 1730 1530 25 1500 1490 1510 Refer to the data above. Construct the ANOVA table manually. Show your calcu a. SSTotal b. SSTreatment c. SSError d. Degree of freedom e. Mean square error f.E statistics
3.24 An article in the ACI Materials Journal (Vol. 84, 1987, pp. 213–216) describes several experiments investigating the rodding of concrete to remove entrapped air. A 3-inch × 6-inch cylinder was used, and the number of times this rod was used is the design variable. The resulting compressive strength of the concrete specimen is the response. The data are shown in the following table: Rodding Level Compressive Strength 10 1530 1530 1440 15 1610 1650 1500 20 1560 1730 1530 25 1500 1490 1510 Refer to the data above. Construct the ANOVA table manually. Show your calcu a. SSTotal b. SSTreatment c. SSError d. Degree of freedom e. Mean square error f.E statistics

Linear Algebra: A Modern Introduction
4th Edition
ISBN:9781285463247
Author:David Poole
Publisher:David Poole
Chapter7: Distance And Approximation
Section7.3: Least Squares Approximation
Problem 31EQ

Related questions
Question
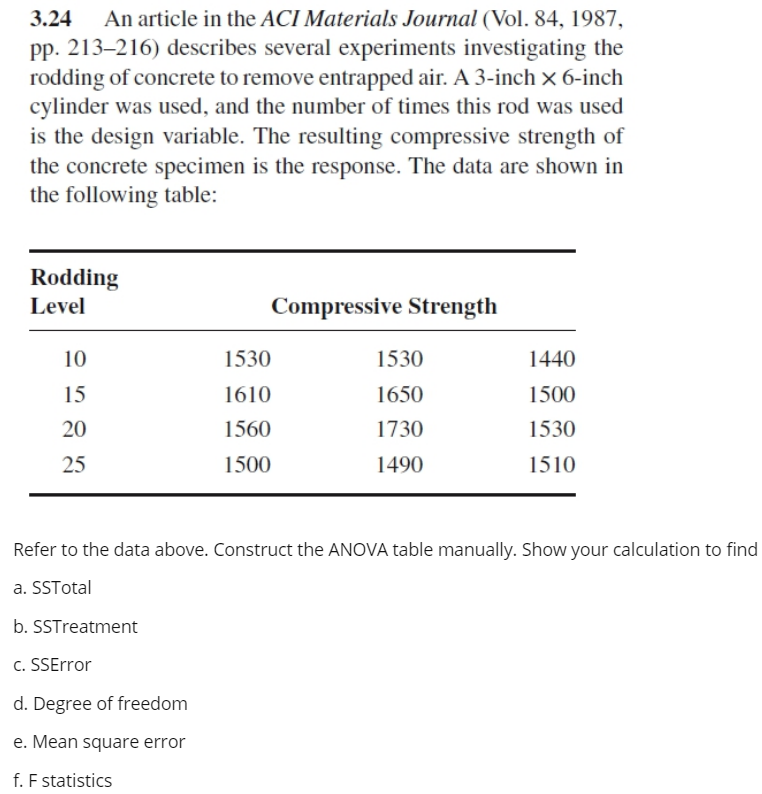
Transcribed Image Text:3.24
An article in the ACI Materials Journal (Vol. 84, 1987,
pp. 213–216) describes several experiments investigating the
rodding of concrete to remove entrapped air. A 3-inch × 6-inch
cylinder was used, and the number of times this rod was used
is the design variable. The resulting compressive strength of
the concrete specimen is the response. The data are shown in
the following table:
Rodding
Level
Compressive Strength
10
1530
1530
1440
15
1610
1650
1500
20
1560
1730
1530
25
1500
1490
1510
Refer to the data above. Construct the ANOVA table manually. Show your calculation to find
a. SSTotal
b. SSTreatment
c. SSError
d. Degree of freedom
e. Mean square error
f. F statistics
Expert Solution
This question has been solved!
Explore an expertly crafted, step-by-step solution for a thorough understanding of key concepts.

This is a popular solution!

Trending now
This is a popular solution!

Step by step
Solved in 2 steps

Recommended textbooks for you
Linear Algebra: A Modern Introduction
Algebra
ISBN:
9781285463247
Author:
David Poole
Publisher:
Cengage Learning

Algebra & Trigonometry with Analytic Geometry
Algebra
ISBN:
9781133382119
Author:
Swokowski
Publisher:
Cengage

Glencoe Algebra 1, Student Edition, 9780079039897…
Algebra
ISBN:
9780079039897
Author:
Carter
Publisher:
McGraw Hill
Linear Algebra: A Modern Introduction
Algebra
ISBN:
9781285463247
Author:
David Poole
Publisher:
Cengage Learning
Algebra & Trigonometry with Analytic Geometry
Algebra
ISBN:
9781133382119
Author:
Swokowski
Publisher:
Cengage
Glencoe Algebra 1, Student Edition, 9780079039897…
Algebra
ISBN:
9780079039897
Author:
Carter
Publisher:
McGraw Hill

Trigonometry (MindTap Course List)
Trigonometry
ISBN:
9781337278461
Author:
Ron Larson
Publisher:
Cengage Learning