1) A professor is studying exam scores. As part of the study, the professor takes a sample of 25 exams and records the score. The data appear in the Exams worksheet of the Quiz 2 Review Problems data workbook on Moodle. a) Estimate o' using a 95% confidence interval. b) State the Hypothesis to show the variance in exam score is different than 64. c) Choose a level of a. Use a = 0.05 for this problem. d) Sketch the sampling distribution. Include the critical value and test statistic e) Draw a conclusion and report that in the problem context. f) Calculate the p-value for the hypothesis test Score 80 73 81 78 88 79 77 84 62 70 69 75 84 77 75 71 65 79 68 85 74 52 70 77 84
1) A professor is studying exam scores. As part of the study, the professor takes a sample of 25 exams and records the score. The data appear in the Exams worksheet of the Quiz 2 Review Problems data workbook on Moodle. a) Estimate o' using a 95% confidence interval. b) State the Hypothesis to show the variance in exam score is different than 64. c) Choose a level of a. Use a = 0.05 for this problem. d) Sketch the sampling distribution. Include the critical value and test statistic e) Draw a conclusion and report that in the problem context. f) Calculate the p-value for the hypothesis test Score 80 73 81 78 88 79 77 84 62 70 69 75 84 77 75 71 65 79 68 85 74 52 70 77 84

College Algebra (MindTap Course List)
12th Edition
ISBN:9781305652231
Author:R. David Gustafson, Jeff Hughes
Publisher:R. David Gustafson, Jeff Hughes
Chapter8: Sequences, Series, And Probability
Section8.7: Probability
Problem 58E: What is meant by the sample space of an experiment?

Related questions
Question
100%
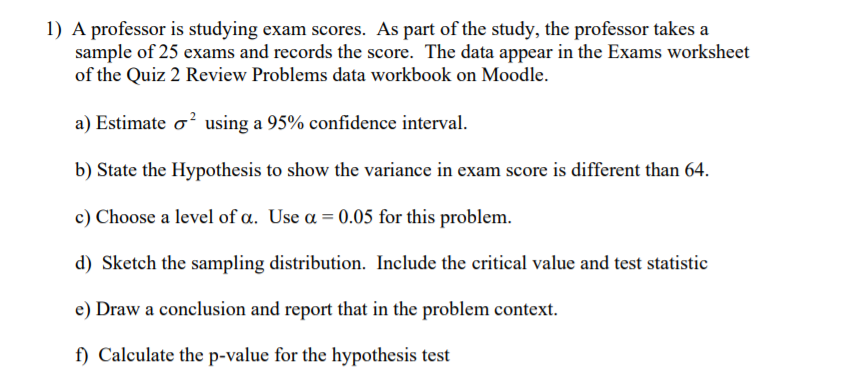
Transcribed Image Text:1) A professor is studying exam scores. As part of the study, the professor takes a
sample of 25 exams and records the score. The data appear in the Exams worksheet
of the Quiz 2 Review Problems data workbook on Moodle.
a) Estimate o' using a 95% confidence interval.
b) State the Hypothesis to show the variance in exam score is different than 64.
c) Choose a level of a. Use a = 0.05 for this problem.
d) Sketch the sampling distribution. Include the critical value and test statistic
e) Draw a conclusion and report that in the problem context.
f) Calculate the p-value for the hypothesis test
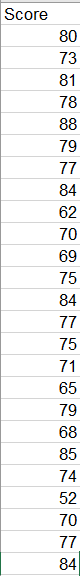
Transcribed Image Text:Score
80
73
81
78
88
79
77
84
62
70
69
75
84
77
75
71
65
79
68
85
74
52
70
77
84
Expert Solution
This question has been solved!
Explore an expertly crafted, step-by-step solution for a thorough understanding of key concepts.

This is a popular solution!

Trending now
This is a popular solution!

Step by step
Solved in 4 steps with 5 images

Recommended textbooks for you
College Algebra (MindTap Course List)
Algebra
ISBN:
9781305652231
Author:
R. David Gustafson, Jeff Hughes
Publisher:
Cengage Learning
College Algebra (MindTap Course List)
Algebra
ISBN:
9781305652231
Author:
R. David Gustafson, Jeff Hughes
Publisher:
Cengage Learning