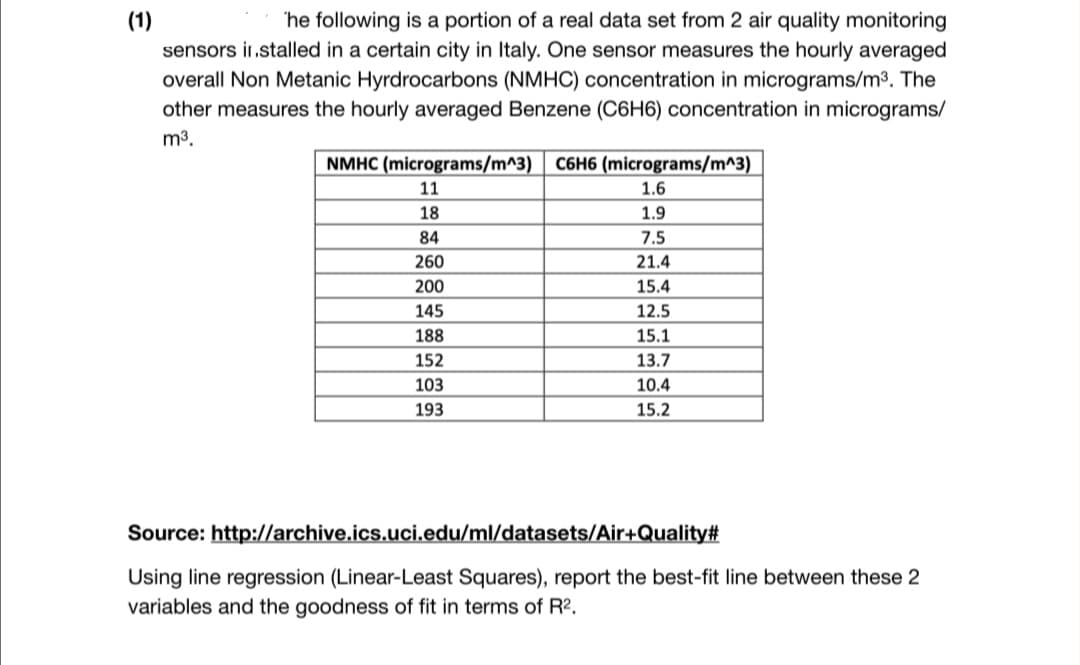
(1) sensors ir.stalled in a certain city in Italy. One sensor measures the hourly averaged overall Non Metanic Hyrdrocarbons (NMHC) concentration in micrograms/m3. The other measures the hourly averaged Benzene (C6H6) concentration in micrograms/ 'he following is a portion of a real data set from 2 air quality monitoring m3. NMHC (micrograms/m^3) C6H6 (micrograms/m^3) 11 1.6 18 1.9 84 7.5 260 21.4 200 15.4 145 12.5 188 15.1 152 13.7 103 10.4 193 15.2 Source: http://archive.ics.uci.edu/ml/datasets/Air+Quality# Using line regression (Linear-Least Squares), report the best-fit line between these 2 variables and the goodness of fit in terms of R?.
(1) sensors ir.stalled in a certain city in Italy. One sensor measures the hourly averaged overall Non Metanic Hyrdrocarbons (NMHC) concentration in micrograms/m3. The other measures the hourly averaged Benzene (C6H6) concentration in micrograms/ 'he following is a portion of a real data set from 2 air quality monitoring m3. NMHC (micrograms/m^3) C6H6 (micrograms/m^3) 11 1.6 18 1.9 84 7.5 260 21.4 200 15.4 145 12.5 188 15.1 152 13.7 103 10.4 193 15.2 Source: http://archive.ics.uci.edu/ml/datasets/Air+Quality# Using line regression (Linear-Least Squares), report the best-fit line between these 2 variables and the goodness of fit in terms of R?.

Advanced Engineering Mathematics
10th Edition
ISBN:9780470458365
Author:Erwin Kreyszig
Publisher:Erwin Kreyszig
Chapter2: Second-order Linear Odes
Section: Chapter Questions
Problem 1RQ

Related questions
Question
Transcribed Image Text:(1)
sensors ir.stalled in a certain city in Italy. One sensor measures the hourly averaged
overall Non Metanic Hyrdrocarbons (NMHC) concentration in micrograms/m3. The
other measures the hourly averaged Benzene (C6H6) concentration in micrograms/
'he following is a portion of a real data set from 2 air quality monitoring
m3.
NMHC (micrograms/m^3) C6H6 (micrograms/m^3)
11
1.6
18
1.9
84
7.5
260
21.4
200
15.4
145
12.5
188
15.1
152
13.7
103
10.4
193
15.2
Source: http://archive.ics.uci.edu/ml/datasets/Air+Quality#
Using line regression (Linear-Least Squares), report the best-fit line between these 2
variables and the goodness of fit in terms of R?.
Expert Solution
This question has been solved!
Explore an expertly crafted, step-by-step solution for a thorough understanding of key concepts.

Step by step
Solved in 3 steps with 3 images

Knowledge Booster


Learn more about
Need a deep-dive on the concept behind this application? Look no further. Learn more about this topic, advanced-math and related others by exploring similar questions and additional content below.Recommended textbooks for you
Advanced Engineering Mathematics
Advanced Math
ISBN:
9780470458365
Author:
Erwin Kreyszig
Publisher:
Wiley, John & Sons, Incorporated

Numerical Methods for Engineers
Advanced Math
ISBN:
9780073397924
Author:
Steven C. Chapra Dr., Raymond P. Canale
Publisher:
McGraw-Hill Education

Introductory Mathematics for Engineering Applicat…
Advanced Math
ISBN:
9781118141809
Author:
Nathan Klingbeil
Publisher:
WILEY
Advanced Engineering Mathematics
Advanced Math
ISBN:
9780470458365
Author:
Erwin Kreyszig
Publisher:
Wiley, John & Sons, Incorporated
Numerical Methods for Engineers
Advanced Math
ISBN:
9780073397924
Author:
Steven C. Chapra Dr., Raymond P. Canale
Publisher:
McGraw-Hill Education
Introductory Mathematics for Engineering Applicat…
Advanced Math
ISBN:
9781118141809
Author:
Nathan Klingbeil
Publisher:
WILEY

Mathematics For Machine Technology
Advanced Math
ISBN:
9781337798310
Author:
Peterson, John.
Publisher:
Cengage Learning,

