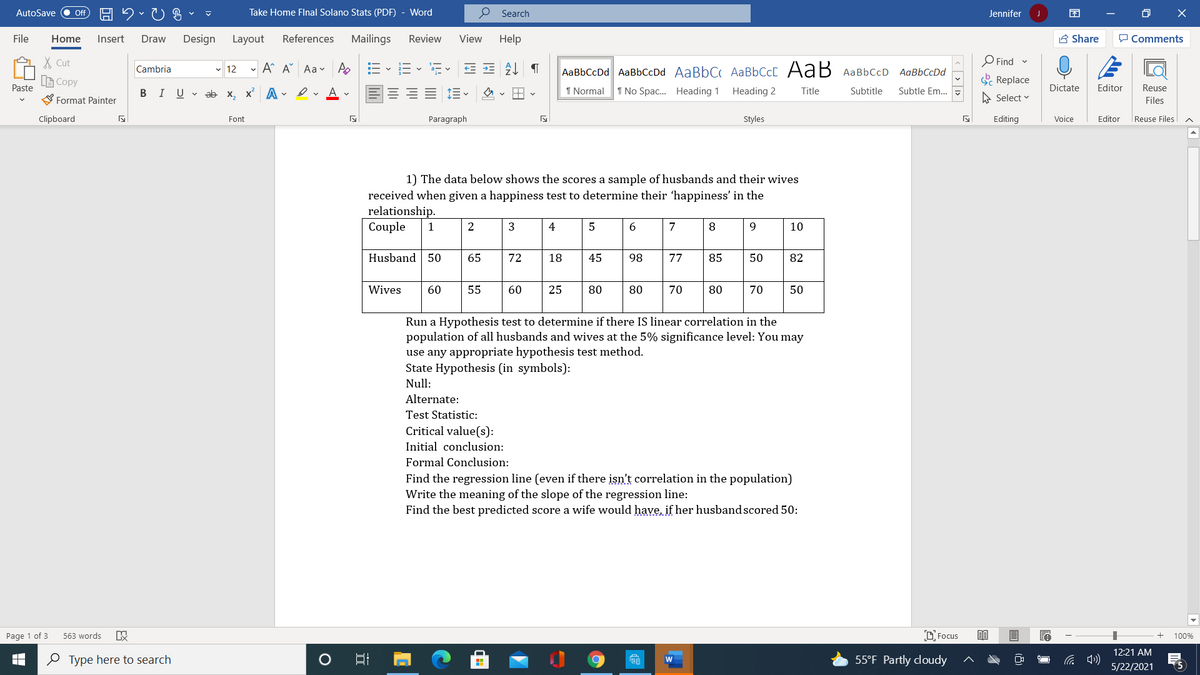
1) The data below shows the scores a sample of husbands and their wives received when given a happiness test to determine their 'happiness' in the relationship. Couple 1 |2 3 |5 6 7 8 9. 4 10 Husband 50 65 72 18 45 98 77 85 50 82 Wives 60 55 60 25 80 70 80 70 50 80 Run a Hypothesis test to determine if there IS linear correlation in the population of all husbands and wives at the 5% significance level: You may use any appropriate hypothesis test method. State Hypothesis (in symbols): Null: Alternate: Test Statistic: Critical value(s): Initial conclusion: Formal Conclusion:


Correlation
Correlation defines a relationship between two independent variables. It tells the degree to which variables move in relation to each other. When two sets of data are related to each other, there is a correlation between them.
Linear Correlation
A correlation is used to determine the relationships between numerical and categorical variables. In other words, it is an indicator of how things are connected to one another. The correlation analysis is the study of how variables are related.
Regression Analysis
Regression analysis is a statistical method in which it estimates the relationship between a dependent variable and one or more independent variable. In simple terms dependent variable is called as outcome variable and independent variable is called as predictors. Regression analysis is one of the methods to find the trends in data. The independent variable used in Regression analysis is named Predictor variable. It offers data of an associated dependent variable regarding a particular outcome.


Trending now
This is a popular solution!

Step by step
Solved in 2 steps


