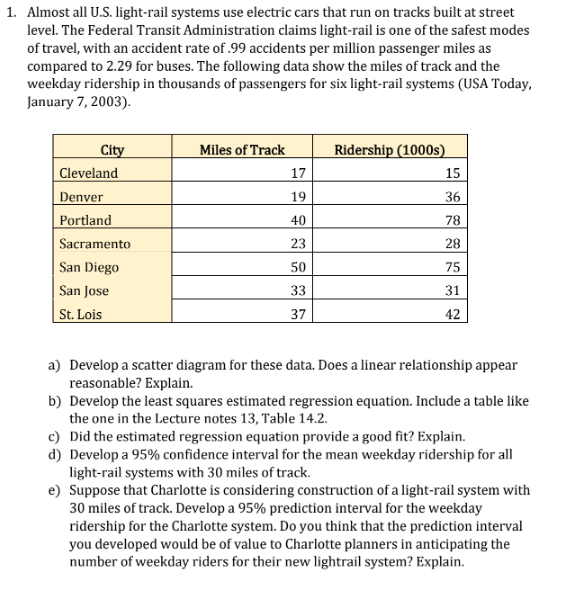
1. Almost all U.S. light-rail systems use electric cars that run on tracks built at street level. The Federal Transit Administration claims light-rail is one of the safest modes of travel, with an accident rate of .99 accidents per million passenger miles as compared to 2.29 for buses. The following data show the miles of track and the weekday ridership in thousands of passengers for six light-rail systems (USA Today, January 7, 2003). City Miles of Track Ridership (1000s) Cleveland 17 15 Denver 19 36 Portland 40 78 Sacramento 23 28 San Diego 50 75 | San Jose St. Lois 33 31 37 42 a) Develop a scatter diagram for these data. Does a linear relationship appear reasonable? Explain. b) Develop the least squares estimated regression equation. Include a table like the one in the Lecture notes 13, Table 14.2. c) Did the estimated regression equation provide a good fit? Explain. d) Develop a 95% confidence interval for the mean weekday ridership for all light-rail systems with 30 miles of track. e) Suppose that Charlotte is considering construction of a light-rail system with 30 miles of track. Develop a 95% prediction interval for the weekday ridership for the Charlotte system. Do you think that the prediction interval you developed would be of value to Charlotte planners in anticipating the number of weekday riders for their new lightrail system? Explain.


Inverse Normal Distribution
The method used for finding the corresponding z-critical value in a normal distribution using the known probability is said to be an inverse normal distribution. The inverse normal distribution is a continuous probability distribution with a family of two parameters.
Mean, Median, Mode
It is a descriptive summary of a data set. It can be defined by using some of the measures. The central tendencies do not provide information regarding individual data from the dataset. However, they give a summary of the data set. The central tendency or measure of central tendency is a central or typical value for a probability distribution.
Z-Scores
A z-score is a unit of measurement used in statistics to describe the position of a raw score in terms of its distance from the mean, measured with reference to standard deviation from the mean. Z-scores are useful in statistics because they allow comparison between two scores that belong to different normal distributions.

Step by step
Solved in 4 steps with 1 images


