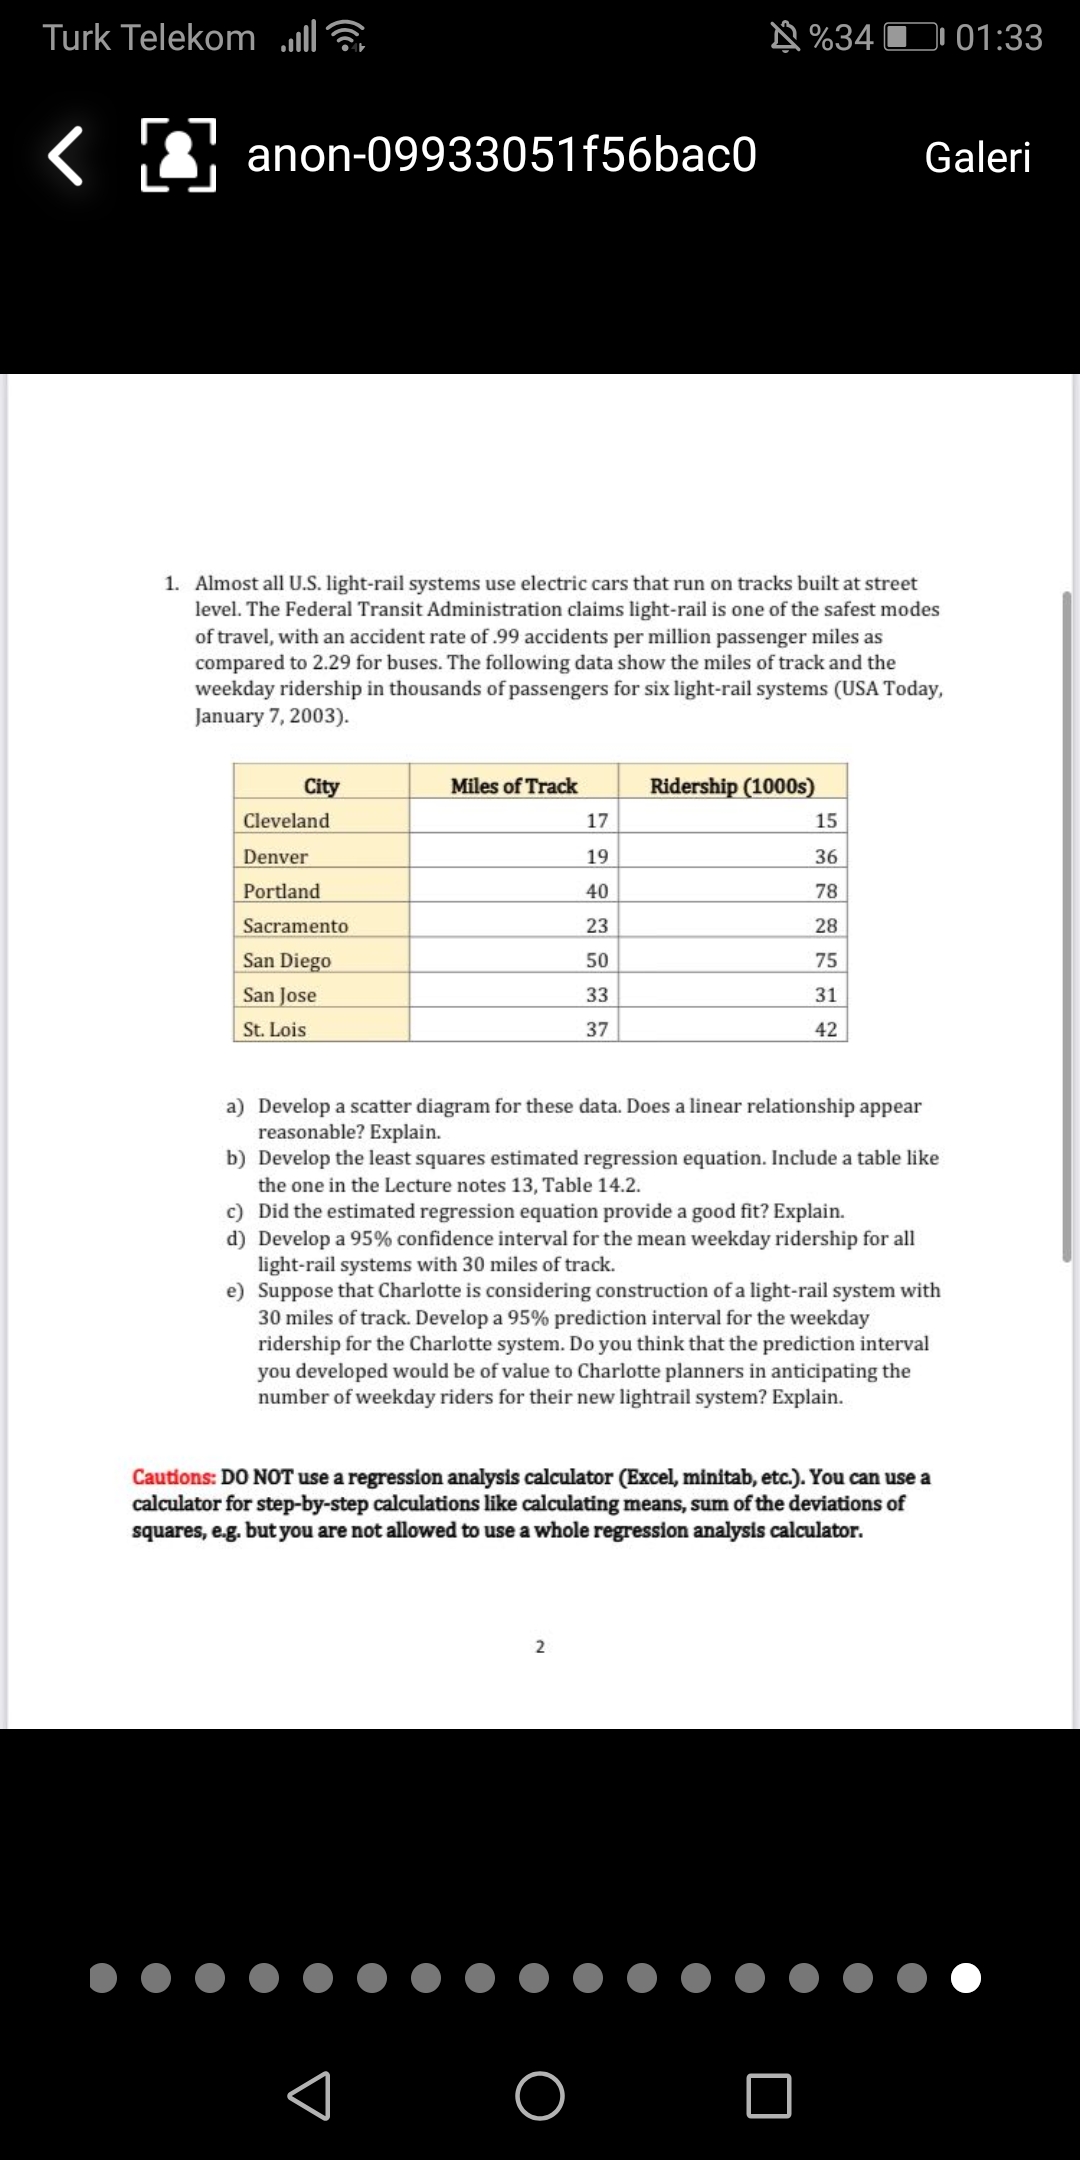
1. Almost all U.S. light-rail systems use electric cars that run on tracks built at street level. The Federal Transit Administration claims light-rail is one of the safest modes of travel, with an accident rate of.99 accidents per million passenger miles as compared to 2.29 for buses. The following data show the miles of track and the weekday ridership in thousands of passengers for six light-rail systems (USA Today, January 7, 2003). City Miles of Track Ridership (1000s) Cleveland 17 15 Denver 19 36 Portland 40 78 Sacramento 23 28 San Diego 50 75 San Jose 33 31 St. Lois 37 42 a) Develop a scatter diagram for these data. Does a linear relationship appear reasonable? Explain. b) Develop the least squares estimated regression equation. Include a table like the one in the Lecture notes 13, Table 14.2. c) Did the estimated regression equation provide a good fit? Explain. d) Develop a 95% confidence interval for the mean weekday ridership for all light-rail systems with 30 miles of track. e) Suppose that Charlotte is considering construction of a light-rail system with 30 miles of track. Develop a 95% prediction interval for the weekday ridership for the Charlotte system. Do you think that the prediction interval you developed would be of value to Charlotte planners in anticipating the number of weekday riders for their new lightrail system? Explain.


Unitary Method
The word “unitary” comes from the word “unit”, which means a single and complete entity. In this method, we find the value of a unit product from the given number of products, and then we solve for the other number of products.
Speed, Time, and Distance
Imagine you and 3 of your friends are planning to go to the playground at 6 in the evening. Your house is one mile away from the playground and one of your friends named Jim must start at 5 pm to reach the playground by walk. The other two friends are 3 miles away.
Profit and Loss
The amount earned or lost on the sale of one or more items is referred to as the profit or loss on that item.
Units and Measurements
Measurements and comparisons are the foundation of science and engineering. We, therefore, need rules that tell us how things are measured and compared. For these measurements and comparisons, we perform certain experiments, and we will need the experiments to set up the devices.
Please dont use Excel. Calculate to paper with detail. Please calculate to all options. Please.

Step by step
Solved in 3 steps with 4 images


