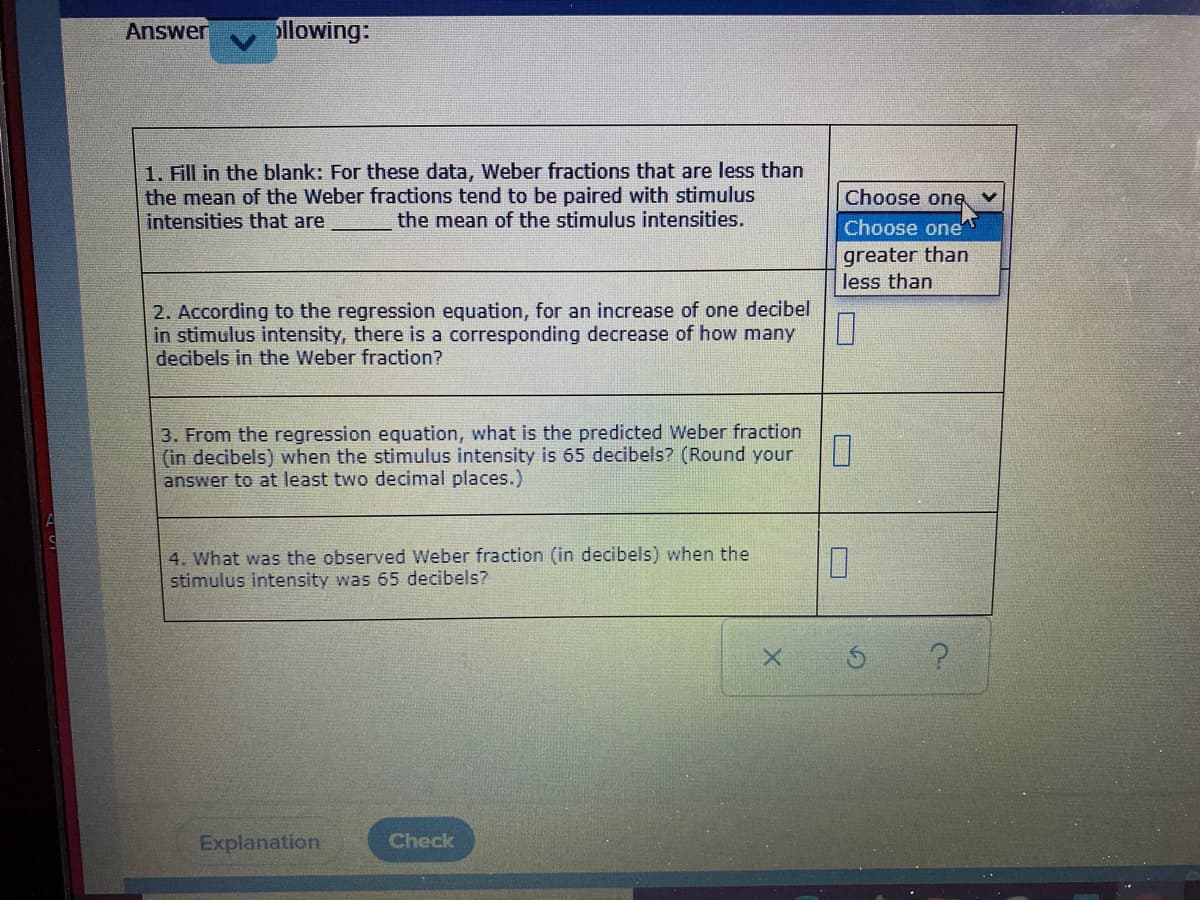
1. Fill in the blank: For these data, Weber fractions that are less than the mean of the Weber fractions tend to be paired with stimulus intensities that are the mean of the stimulus intensities. 2. According to the regression equation, for an increase of one decibel in stimulus intensity, there is a corresponding decrease of how many decibels in the Weber fraction? 3. From the regression equation, what is the predicted Weber fraction (in decibels) when the stimulus intensity is 65 decibels? (Round your answer to at least two decimal places.) 4. What was the observed Weber fraction (in decibels) when the stimulus intensity was 65 decibels?

Linear Algebra: A Modern Introduction
4th Edition
ISBN:9781285463247
Author:David Poole
Publisher:David Poole
Chapter4: Eigenvalues And Eigenvectors
Section4.6: Applications And The Perron-frobenius Theorem
Problem 24EQ
icon
Related questions
icon
Concept explainers
Question
Campus Login
Hi Week 8- MAT300457VA016-121 x
A ALEKS - Shasia Gibbs - Learn
→ C
A www-awn.aleks.com/alekscgi/x/Isl.exe/1o_u-lgNslkr7j8P3jH-Iv-6txjbonmDn7WsVrRAXK6XnHkiRvH2tl80GOCPOPxmB3tDIGhaxzPV3C7jOfhOhWvpfMzFtGpPfJI-Pa_5LIF..
O REGRESSION AND CORRELATION
Predictions from the least-squares regression line
Sh
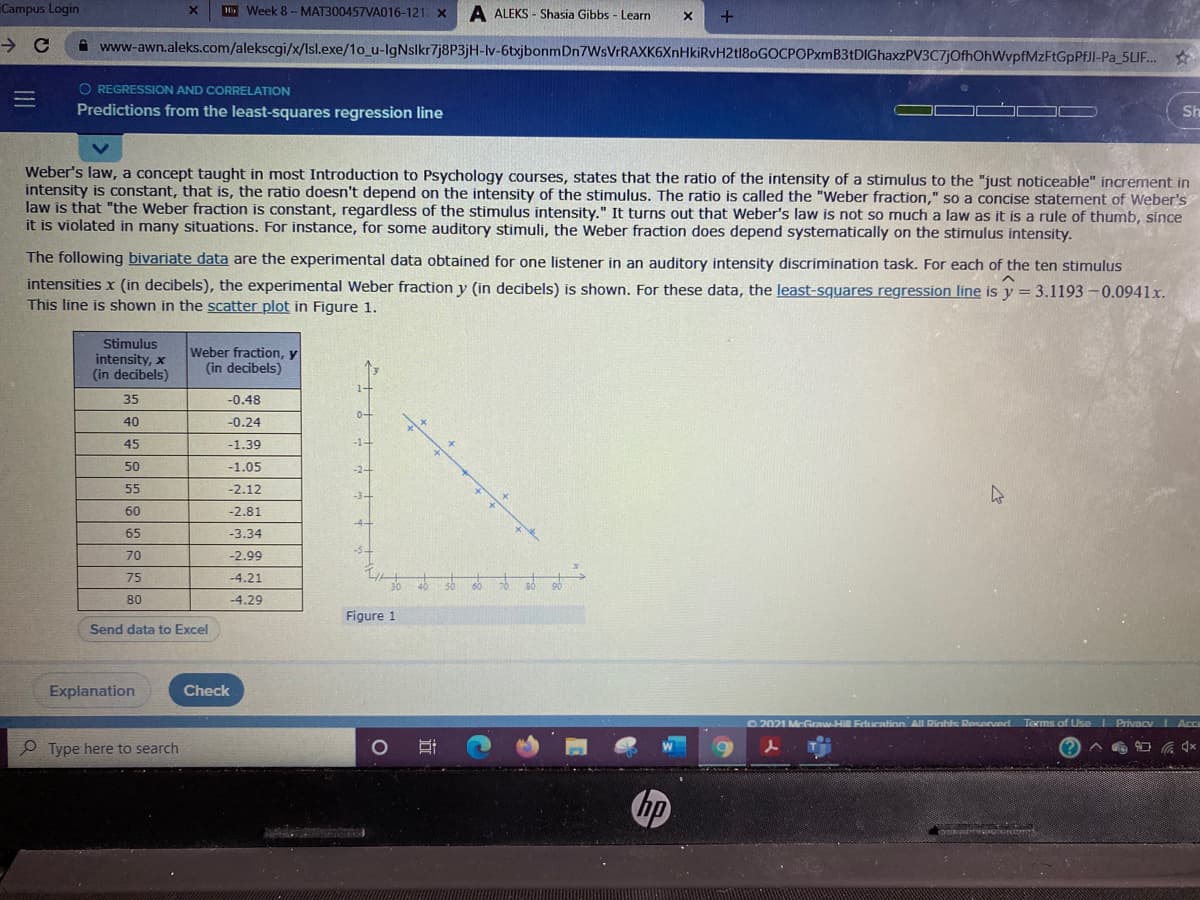
Weber's law, a concept taught in most Introduction to Psychology courses, states that the ratio of the intensity of a stimulus to the "just noticeable" increment in
intensity is constant, that is, the ratio doesn't depend on the intensity of the stimulus. The ratio is called the "Weber fraction," so a concise statement of Weber's
law is that "the Weber fraction is constant, regardless of the stimulus intensity." It turns out that Weber's law is not so much a law as it is a rule of thumb, since
it is violated in many situations. For instance, for some auditory stimuli, the Weber fraction does depend systematically on the stimulus intensity.
The following bivariate data are the experimental data obtained for one listener in an auditory intensity discrimination task. For each of the ten stimulus
intensities x (in decibels), the experimental Weber fraction y (in decibels) is shown. For these data, the least-squares regression line is y = 3.1193 -0.0941x.
This line is shown in the scatter plot in Figure 1.
Stimulus
intensity, x
(in decibels)
Weber fraction, y
(in decibels)
1-
35
-0.48
0+
40
-0.24
45
-1.39
-1+
50
-1.05
-2+
55
-2.12
-3+
60
-2.81
-4+
65
-3.34
70
-2.99
75
-4.21
30
80
-4.29
Figure 1
Send data to Excel
Explanation
Check
02021 McGraw-Hill Fducation All Rinhts Roserved
Torms of Use PrivaCV Ac
P Type here to search
O.
hp
Transcribed Image Text:Campus Login Hi Week 8- MAT300457VA016-121 x A ALEKS - Shasia Gibbs - Learn → C A www-awn.aleks.com/alekscgi/x/Isl.exe/1o_u-lgNslkr7j8P3jH-Iv-6txjbonmDn7WsVrRAXK6XnHkiRvH2tl80GOCPOPxmB3tDIGhaxzPV3C7jOfhOhWvpfMzFtGpPfJI-Pa_5LIF.. O REGRESSION AND CORRELATION Predictions from the least-squares regression line Sh Weber's law, a concept taught in most Introduction to Psychology courses, states that the ratio of the intensity of a stimulus to the "just noticeable" increment in intensity is constant, that is, the ratio doesn't depend on the intensity of the stimulus. The ratio is called the "Weber fraction," so a concise statement of Weber's law is that "the Weber fraction is constant, regardless of the stimulus intensity." It turns out that Weber's law is not so much a law as it is a rule of thumb, since it is violated in many situations. For instance, for some auditory stimuli, the Weber fraction does depend systematically on the stimulus intensity. The following bivariate data are the experimental data obtained for one listener in an auditory intensity discrimination task. For each of the ten stimulus intensities x (in decibels), the experimental Weber fraction y (in decibels) is shown. For these data, the least-squares regression line is y = 3.1193 -0.0941x. This line is shown in the scatter plot in Figure 1. Stimulus intensity, x (in decibels) Weber fraction, y (in decibels) 1- 35 -0.48 0+ 40 -0.24 45 -1.39 -1+ 50 -1.05 -2+ 55 -2.12 -3+ 60 -2.81 -4+ 65 -3.34 70 -2.99 75 -4.21 30 80 -4.29 Figure 1 Send data to Excel Explanation Check 02021 McGraw-Hill Fducation All Rinhts Roserved Torms of Use PrivaCV Ac P Type here to search O. hp
Answer
ollowing:
1. Fill in the blank: For these data, Weber fractions that are less than
the mean of the Weber fractions tend to be paired with stimulus
intensities that are
Choose onę
the mean of the stimulus intensities.
Choose one'
greater than
less than
2. According to the regression equation, for an increase of one decibel
in stimulus intensity, there is a corresponding decrease of how many
decibels in the Weber fraction?
3. From the regression equation, what is the predicted Weber fraction
(in decibels) when the stimulus intensity is 65 decibels? (Round your
answer to at least two decimal places.)
4. What was the observed Weber fraction (in decibels) when the
stimulus intensity was 65 decibels?
Explanation
Check
Transcribed Image Text:Answer ollowing: 1. Fill in the blank: For these data, Weber fractions that are less than the mean of the Weber fractions tend to be paired with stimulus intensities that are Choose onę the mean of the stimulus intensities. Choose one' greater than less than 2. According to the regression equation, for an increase of one decibel in stimulus intensity, there is a corresponding decrease of how many decibels in the Weber fraction? 3. From the regression equation, what is the predicted Weber fraction (in decibels) when the stimulus intensity is 65 decibels? (Round your answer to at least two decimal places.) 4. What was the observed Weber fraction (in decibels) when the stimulus intensity was 65 decibels? Explanation Check
Expert Solution
Step 1

As per the Weber's law, we can draw the inference that Weber's fraction doesn't depends upon the intensity of stimulus.

When the experimental data was plotted, we got a straight line with negative slope (-0.0941) and a positive intercept.


trending now

Trending now

This is a popular solution!

steps

Step by step

Solved in 5 steps

Blurred answer
Knowledge Booster
Correlation, Regression, and Association
Learn more about
Need a deep-dive on the concept behind this application? Look no further. Learn more about this topic, statistics and related others by exploring similar questions and additional content below.
Similar questions
  • SEE MORE QUESTIONS
Recommended textbooks for you
Linear Algebra: A Modern Introduction
Algebra
ISBN:
9781285463247
Author:
David Poole
Publisher:
Cengage Learning