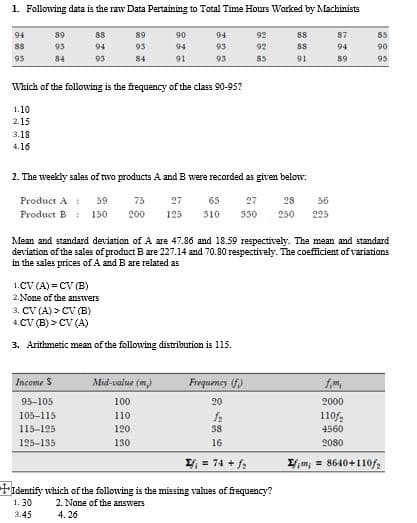
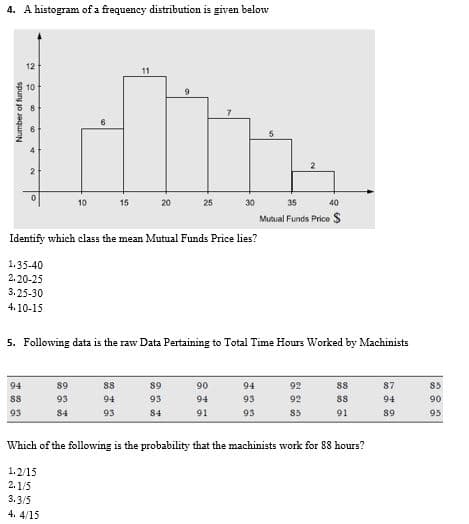
1. Following data is the raw Data Pertaining to Total Time Hours Worked by Machinists 94 89 88 89 90 94 92 88 87 85 88 95 94 93 94 93 92 88 04 90 93 84 95 84 91 93 85 91 89 95 Which of the following is the frequency of the class 90-95? 1.10 2.15 3.18 4.16 2. The weekly sales of two products A and B were recorded as given below: Product A: Product B: 59 75 27 63 27 28 56 150 200 125 510 330 250 225 Mean and standard deviation ofA are 47.86 and 18.59 respectively. The mean and standard deviation of the sales of product B are 227.14 and 70.80 respectively. The coefficient of variatioans in the sales prices of A and B are related as 1.CV (A) = CV (B) 2.None of the answers 3. CV (A) > CV (B) 4.CV (B) > CV (A) 3. Arithmetic mean of the following distribution is 115. Income S Mid-value (m) Frequency (f) fm 95-105 100 20 2000 105-115 110 110f, 4560 115-125 120 38 125-135 130 16 2080 = 74 + /, m, = 8640+11of2 "Identify which of the following is the missing values of frequency? 1. 30 2. None of the answers 3.45 4. 26


Family of Curves
A family of curves is a group of curves that are each described by a parametrization in which one or more variables are parameters. In general, the parameters have more complexity on the assembly of the curve than an ordinary linear transformation. These families appear commonly in the solution of differential equations. When a constant of integration is added, it is normally modified algebraically until it no longer replicates a plain linear transformation. The order of a differential equation depends on how many uncertain variables appear in the corresponding curve. The order of the differential equation acquired is two if two unknown variables exist in an equation belonging to this family.
XZ Plane
In order to understand XZ plane, it's helpful to understand two-dimensional and three-dimensional spaces. To plot a point on a plane, two numbers are needed, and these two numbers in the plane can be represented as an ordered pair (a,b) where a and b are real numbers and a is the horizontal coordinate and b is the vertical coordinate. This type of plane is called two-dimensional and it contains two perpendicular axes, the horizontal axis, and the vertical axis.
Euclidean Geometry
Geometry is the branch of mathematics that deals with flat surfaces like lines, angles, points, two-dimensional figures, etc. In Euclidean geometry, one studies the geometrical shapes that rely on different theorems and axioms. This (pure mathematics) geometry was introduced by the Greek mathematician Euclid, and that is why it is called Euclidean geometry. Euclid explained this in his book named 'elements'. Euclid's method in Euclidean geometry involves handling a small group of innately captivate axioms and incorporating many of these other propositions. The elements written by Euclid are the fundamentals for the study of geometry from a modern mathematical perspective. Elements comprise Euclidean theories, postulates, axioms, construction, and mathematical proofs of propositions.
Lines and Angles
In a two-dimensional plane, a line is simply a figure that joins two points. Usually, lines are used for presenting objects that are straight in shape and have minimal depth or width.
MCQ'S


Trending now
This is a popular solution!

Step by step
Solved in 2 steps


