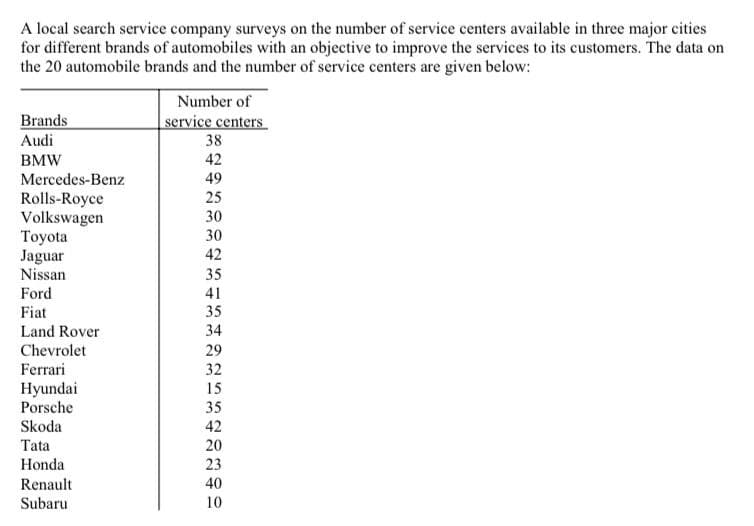
1. How many automobile brands have centers between 20 and 29 in these three cities? 2. How many automobile brands have more than 40 centers in these cities?


Q: The results below are based on data collected on campus as part of a student project for an…
A: Given:- Data was collected to compare the proportion of "Greeks" and non-"Greeks" who…
Q: Problem I) Given the random variable, Yhas the following CDF: Fy(y) 1 0.75 0.5 0.25 a) Find Pu(u).…
A: Problem 1) The CDF of Y is FY(y)=0y<10.251≤y<20.52≤y<31y≥3 From the graph of CDF of Y, we…
Q: 16. For the data in the following matrix: Male Female No Treatment Treatment M = 8 M = 14 M = 4 M =…
A: Introduction: It is required to describe the main and interaction effects
Q: 8. Use any method to calculate the sample mean, median, and standard deviation of the following…
A: Introduction: The mean, median, standard deviation of the values must be calculated for the first…
Q: Home Internet Access According to a study, 75% of adults ages 18-29 years had broadband Internet…
A: According to the given information, we have Given that a researcher wanted to estimate the…
Q: A survey of 100 people in the Metropolitan Region indicated that 56% of them need credit to complete…
A:
Q: 28. A random variable X has a bell-shaped symmetric distribu- tion, with expected value = 100 and…
A: GIVEN DATA bell shaped distribution μ = 100σ = 30
Q: 4. When a polling organization randomly calls households for a survey, there is a 0.10 probability…
A: Given that Probability that are able to obtain a response (P) = 0.10 Number of households…
Q: • The following information was obtained from a CRD with 6 treatments and 5 replications per…
A: The given data is Trt A Trt B Trt C Trt D Trt E Trt F ∑Xi 7.8 7.4 13.8 12.2 5.9 14.2 ∑Xi2…
Q: A normal distribution has mean 62.1 and standard deviation 2.42. Find the data value corresponding…
A: According to the given information, we have Mean = 62.1 Standard deviation = 2.42 Z-score = -1.33
Q: Regardless of the kind of workout a gym goer does, the mean time spent on the treadmill is 45…
A: Given,sample size(n)=36mean(μ)=45standard deviation(σ)=15
Q: (b) Upper-tailed test, n = 13, t = 3.2 P-value 0.05 x (c) Lower-tailed test, df = 10, t= -2.3…
A: The objective is to obtain the p-value for the provided t-scores with the respective degrees of…
Q: Find the percent of the total area under the standard normal curve between the following z-scores.…
A: According to the given information, we have Z scores are -1.2 and -0.65 The distribution is standard…
Q: SAT Scores Estimate the variance in mean mathematics SAT scores by state, using the randomly…
A: Given 95% confidence 490,502,211,209,499,572,550,515,500,565,543
Q: The heights of tomato plants are Normally distributed with a mean of 3.56 feet and a standard…
A: Given Mean =3.56 Standard deviation=0.25
Q: Let our function be 1 f(x; 0) ==—= elx-01₁ -∞0 < 0 <∞ 2 Find 0 using the method of moments for…
A: Given that The pdf of x f(x)=1/2e-|x-θ| We have to find the method of moment θ We have to find…
Q: Suppose you take a penny, hold it on it side, and then “flick” it so it spins on the side. Intuition…
A: The information provided in the question are as follows : Population proportion (p) = 0.50 Number…
Q: Assume that the probability of the binomial random variable will be approximated using the normal…
A: Let X follows Binomial distribution. We have to compute the probability that X = 4 I.e P(X = 4).
Q: A machine that paints traffic stripes on roads is mounted on a truck and set to a width of 4 inches.…
A: Followings are the explanation of the question Use the one sample t test for the given problem…
Q: Does it take more time for seeds to germinate if they are near rock music that is continuously…
A: According to the given information in this question There are more than three subparts according to…
Q: confidence level: Observation 1 2 3 4 5 6 7 5600 9 10 DATA 9.07 9.13 2.81 8.18 1.08 4.43 3.74 7.61…
A: Given Enter given data in to excel
Q: Introduction A chain of restaurants has historically had a mean wait time of 9 minutes for its…
A: Z test for hypothesis test of single population mean is used.
Q: May I know how to solve a) and d)?
A: Given Information: Control group: Sample size n1=17 Sample size x¯1=116 Sample standard deviation…
Q: 24. The following table summarizes the results from a two-factor study with two levels of factor A…
A: Given n=5
Q: 6. If we have df = n-1=29= value and, the lower-tail 29 and a/2 = 0.005. The upper-tail Chi-square…
A: Given that df = 29 , α/2 = 0.005
Q: The table below summarizes data from a survey of a sample of women. Using a 0.05 significance level,…
A: The following information has been provided: Observed Frequencies: Man Woman Women who agree…
Q: If the coefficient B₁ has a nonzero value, then it is helpful in predicting the value of the…
A: Regression equation is used to predict the value based on the another variable. It has two types of…
Q: O Two-tailed Step 3: Enter the critical value(s). (Round to 3 decimal places.) Step 4: Enter the…
A: It is given that Population mean, μ = 1250 Sample mean, X̄ = 1239 Sample standard deviation, s = 45…
Q: Step 3: Find the p-value of the test statistic. P(FSV p-value ZA = 8A== 11 IB == SB==
A: The blood sugar level of the patients in group A and group B measured. Group A = medication Group B…
Q: An experiment was implemented to test the effectiveness of a new veterinarian product for dogs.…
A: Given The data is as follows: Trt A Trt B 13.7 13.8 11.7 14.6 13.4 12.3 12.7 12 12.4…
Q: 39.39 Suppose that the observed value of permeability at x = 3.7 is y = 46.1. Calculate the value of…
A: It is given that Least square estimate of the slope = -2.330 Least square estimate of the intercept…
Q: The case involves predicting the value score of a car based on the price of the car, five-year…
A: Please note that as per our guidelines if multiple sub-parts are posted in a question we can answer…
Q: Every year, all incoming high school freshmen in a large school district take a math placement test.…
A: Since you have posted a question with multiple subparts, we will solve first three subparts for you.…
Q: In an experiment, college students were given either four quarters or a $1 bill and they could…
A:
Q: In a sample of credit card holders the mean monthly value of credit card purchases was $ 329 and the…
A: GivenMean(μ)=329sample variance(s2)=78standard deviation(s)=78≅8.83
Q: According to a 2006 survey conducted by the Center for Disease Control and Prevention (CDC), birth…
A: Null hypothesis : Null hypothesis is a statement according to which there exist no relationship…
Q: Calculate the correlation coefficient, r, for the data below. 0 y - 19 X 29 6 4 17 0 -8 -11 O A.…
A: Given data is x y 0 -19 2 -17 9 0 6 -8 4 -11 3 -15 5 -10 7 -6 8 -3 1 -17
Q: ) What is the significance of the smaller standard deviation or Machine 2? Since Machine 2 has a…
A: Machine 1 Population mean μ1=12.4, standard deviations σ1=0.2 Machine 2 Population mean μ2=12.4,…
Q: 3) Try to show the Women's Post-Med blood pressure population standard deviation is less than 11?…
A: It is required to test whether the population standard deviation of Women's Post-Med BP σ is less…
Q: 1. Based on the following information compute ACF at the first and the second lag ((1) and (2)).…
A:
Q: A study of 1,400 women between 18 and 25 years of age in the Coquimbo region showed that 32.7% had…
A: Given sample proportion p^=32.7%=0.327, n=1400 Level of significance ɑ=0.10
Q: Classify the following statement as an example of classical probability, empirical probability, or…
A:
Q: The linear correlation coefficient is (Round to three decimal places as needed.)
A: It is given that The regression equation is Highway = 50.3 - 0.00539 Weight The 95% CI is (…
Q: Use the discrete probability distribution below to find the probability that x equals 4. 9 0.12 X 3…
A: Given, X 3 4 6 9 P(X) 0.06 0.05 0.12
Q: 4. In 2017, a global scale research was conducted to determine the effects of certain factors to…
A: Given Information: Consider the given output that shows the regression results.
Q: The following is the ANOVA obtained from a regression analysis: ANOVA Source of Variation REGRESSION…
A: The incomplete ANOVA table is given.
Q: Below is a graph of a normal distribution with mean μ = -2 and standard deviation = 2. The shaded…
A: Given that Population mean μ=-2 Standard deviation σ=2 Then we have to find the probability that is…
Q: 40) A trucking firm suspects that the variance for a certain tire is greater than 1,000,000. To…
A: Given in the question: H0: variance ≤ 1,000,000 H1 : variance > 1,000,000 n=101
Q: On an airplane, 92% of people are in economy seats (also known as coach.) Of the people in economy,…
A: given data event E : in an economy seatevent F : member of frequent flierP(in an economy seat) =…
Q: Based on the firm's data and the regression line, complete the following. (a) For these data, values…
A: Given that By using excel regression excel > data > data analysis > regression >input…


Trending now
This is a popular solution!

Step by step
Solved in 2 steps

- Daniel Glaser, chairman of the College of San Antonio’sbusiness department, needs to assign professors to courses nextsemester. As a criterion for judging who should teach each course,Professor Glaser reviews the past 2 years’ teaching evaluations (which were filled out by students). Since each of the four profes-sors taught each of the four courses at one time or another during the 2-year period, Glaser is able to record a course rating for eachinstructor. These ratings are shown in the following table.a) Find the assignment of professors to courses to maximize theoverall teaching rating.b) Assign the professors to the courses with the exception thatProfessor Fisher cannot teach statistics. PXPROFESSOR COURSE STATISTICS MANAGEMENT FINANCE ECONOMICSW. W. Fisher 90 65 95 40D. Golhar 70 60 80 75Z. Hug 85 40 80 60N. K. Rustagi 55 80 65 55A music professor offers his 40 students the option of coming to an additional rehearsal session theweek before their juries (musical final exams.) In order to decide whether these extra sessions actuallyhelp students, he keeps track of who attends them and compares their jury scores to those of students who did not schedule extra sessions. In this study, a difference was found between the scores of students who scheduled the extra sessions and those of students who didn't attend(higher average for students with extra sessions) A) Yes, becuase the study relied on a common final exam fro everyone B)No, because the students chose whether they attended the review session or not C) Yes becuase the study included both students who attned the review session and those who did not D)Yes, becuase the number of subjects in the study was large E)No, becuase the students in the study were not blindedClairLinx Wireless, a start-up cell phone company, has divided its market of potential customers into three major groups: single, working; married, working; and retired. ClairLinx surveyed 500 potential customers and asked each, "Of the following, which do you consider to be the most important feature in a cell phone service plan: free nights and weekends, free long distance and roaming, or free calls to customers with the same company?" Each of the 500 potential customers in the survey was categorized according to the service plan feature she considers most important and the customer group in which she appears. The data are summarized in the contingency table below. In the cells of the table are the respective observed frequencies, and three of the cells also have blanks. Fill in these blanks with the frequencies expected if the two variables, type of potential customer and choice of service plan feature, are independent. Round the responses to at least two decimal places. Note:…
- There are 10 males and 18 females in the Data Management class. How many different committees of 5 students can be formed if there must be at least 2 males?Researchers constructed two test sheets, each sheet including 20 photos of the faces of dog–owner pairs taken at a dog lovers' field festival. The 20 sets of dog–owner pairs on the two sheets were equivalent with respect to breed, diversity of appearance, and gender of owners. On the first sheet, the dogs were matched with their owners, while on the second sheet, the dogs and owners were deliberately mismatched. Three experiments were conducted, and in all experiments, subjects were asked to "choose the set of dog–owner pairs that resemble each other, Sheet 1 or Sheet 2," and were simply told the aim of the research was a "survey on dog–owner relationships." In the first experiment, the original sheets were shown to subjects; in the second experiment, just the "mouth region" of the owners was blacked out in all the pictures on both sheets; in the third experiment, just the "eye region" of the owners was blacked out. Subjects were assigned at random to the three experimental groups, and…Researchers constructed two test sheets, each sheet including 20 photos of the faces of dog–owner pairs taken at a dog lovers' field festival. The 20 sets of dog–owner pairs on the two sheets were equivalent with respect to breed, diversity of appearance, and gender of owners. On the first sheet, the dogs were matched with their owners, while on the second sheet, the dogs and owners were deliberately mismatched. Three experiments were conducted, and in all experiments, subjects were asked to "choose the set of dog–owner pairs that resemble each other, Sheet 1 or Sheet 2," and were simply told the aim of the research was a "survey on dog–owner relationships." In the first experiment, the original sheets were shown to subjects; in the second experiment, just the "mouth region" of the owners was blacked out in all the pictures on both sheets; in the third experiment, just the "eye region" of the owners was blacked out. Subjects were assigned at random to the three experimental groups, and…
- The television show CSI: Shoboygan has been successful for many years. That show recently had a share of 19, which means, that among the TV sets in use, 19% were tuned to CSI: Shoboygan. An advertiser wants to verify that 19% share value by conducting its own survey, and a pilot survey begins with 12 households have TV sets in use at the time of a CSI: Shoboygan broadcast.A survey was conducted of two types of marketers. The first type being marketers that focus primarily on attracting business (B2B), and the second type being marketers that primarily target consumers (B2C). It was reported that 518 (88%) of B2B and 246(59%) of B2C marketers commonly use a business social media tool. The study also revealed that 301(51%) of B2B marketers and 248(59%) of B2C marketers commonly use a video social media tool. Suppose the survey was based on 590 B2B marketers and 420 B2C marketers. Complete parts (a) through (c) below. At the 0.05 level of significance, is there evidence of a difference between B2B marketers and B2C marketers in the proportion that commonly use the business social media tool? Let population 1 correspond to B2B marketers and population 2 correspond to B2C marketers. Choose the correct null and alternative hypotheses below. A.H0:π1=π2 H1: π1≠π2 BH0:π1≥π2 H1:π1<π2 C.H0:π1≤π2 H1:π1>π2…Suppose a veterinarian wants to estimate the difference between the proportion of cat owners who are single and the proportion of dog owners who are single. Of the pet owners that visit any of the veterinarian clinics in her city regularly, she identifies 3872 pet owners that exclusively have cats and 4108 pet owners that exclusively have dogs. From this list of pet owners, she surveys 158 randomly selected cat owners and 139 randomly selected dog owners and asks each of them if they are single or married. Her findings are summarized in the table. Population Populationdescription Samplesize Number of successes Sampleproportion 1 cat owners ?1=158 ?1=63 ?̂1=0.39873 2 dog owners ?2=139 ?2=52 ?̂2=0.37410 Calculate the upper and lower limits (bounds) for a large sample 90% ?‑confidence interval for the difference in two population proportions, ?1−?2. Give each of your answers with three decimal places of precision.
- An advertising firm wanting to target people with strong desires for success conducted astudy to see if such people differed in the types of television shows they watched. Randomlyselected participants recorded the shows they watched for a week, then their desire for successwas assessed, and finally they were divided into two groups. Low Success seekers watched 8comedies, 15 romances, 6 documentaries, 13 dramas, and 3 news shows. High Success seekerswatched 3 comedies, 3 romances, 9 documentaries, 7 dramas, and 8 news shows. Using thisdata answer the following: State the populations and hypotheses Create a table for the data using SPSS Conduct a Chi-Squared for independence test using the SPSS program and post outputfile. State the results using the proper APA format. Is the distribution of type of shows watched different for participants having high andlow desires for success?wat is the intermdiate demond of the agricultural,manufacutring,and energy sectorIn the City of Manila, the total population is 1,750,873 and there are six districts within the area. Compute for its average, and the number of people in the clustered group(desire = 90).


