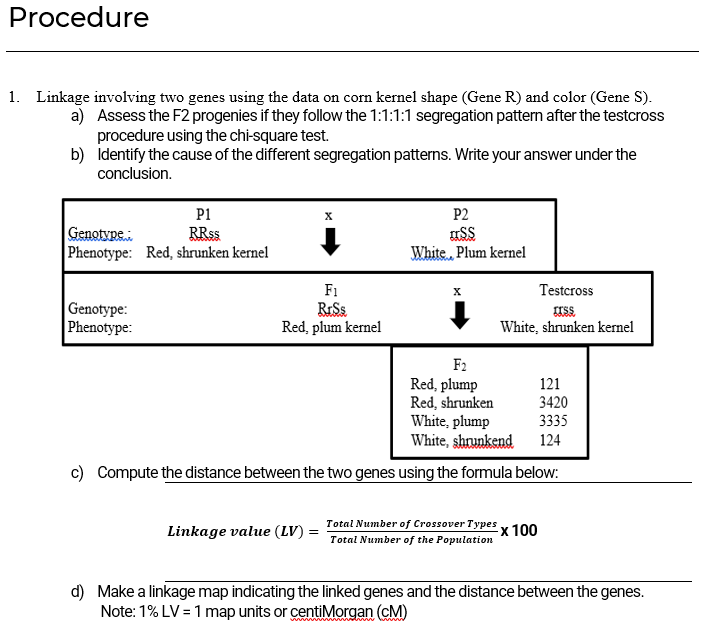
1. Linkage involving two genes using the data on corn kernel shape (Gene R) and color (Gene S). a) Assess the F2 progenies if they follow the 1:1:1:1 segregation pattern after the testcross procedure using the chi-square test. b) identify the cause of the different segregation patterns. Write your answer under the conclusion. P2 SS White. Plum kernel P1 Genotype. Phenotype: Red, shrunken kernel RRSS F1 Testcross Genotype: Phenotype: RISS Red, plum kernel White, shrunken kernel F2 Red, plump Red, shrunken White, plump White, shrunkend 121 3420 3335 124 c) Compute the distance between the two genes using the formula below: Total Number of Crossover Types Linkage value (LV) = x 100 Total Number of the Population d) Make a linkage map indicating the linked genes and the distance between the genes. Note: 1% LV = 1 map units or centiMorgan (cM)
1. Linkage involving two genes using the data on corn kernel shape (Gene R) and color (Gene S). a) Assess the F2 progenies if they follow the 1:1:1:1 segregation pattern after the testcross procedure using the chi-square test. b) identify the cause of the different segregation patterns. Write your answer under the conclusion. P2 SS White. Plum kernel P1 Genotype. Phenotype: Red, shrunken kernel RRSS F1 Testcross Genotype: Phenotype: RISS Red, plum kernel White, shrunken kernel F2 Red, plump Red, shrunken White, plump White, shrunkend 121 3420 3335 124 c) Compute the distance between the two genes using the formula below: Total Number of Crossover Types Linkage value (LV) = x 100 Total Number of the Population d) Make a linkage map indicating the linked genes and the distance between the genes. Note: 1% LV = 1 map units or centiMorgan (cM)

Human Heredity: Principles and Issues (MindTap Course List)
11th Edition
ISBN:9781305251052
Author:Michael Cummings
Publisher:Michael Cummings
Chapter19: Population Genetics And Human Evolution
Section: Chapter Questions
Problem 9QP: Using the HardyWeinberg Law in Human Genetics Suppose you are monitoring the allelic and genotypic...

Related questions

Question
The first photo is the procedure while the other photo is the problem that needs to be answered. Please answer correctly, and provide proper solutions and explanations from A to E. Thank youuuu
Transcribed Image Text:Procedure
1. Linkage involving two genes using the data on corn kernel shape (Gene R) and color (Gene S).
a) Assess the F2 progenies if they follow the 1:1:1:1 segregation pattern after the testcross
procedure using the chi-square test.
b) Identify the cause of the different segregation patterns. Write your answer under the
conclusion.
P1
P2
Genotype.
Phenotype: Red, shrunken kernel
RRSS
White. Plum kernel
F1
RISS
Red, plum kernel
Testcross
Genotype:
Phenotype:
White, shrunken kernel
F2
Red, plump
Red, shrunken
White, plump
White, shrunkend
121
3420
3335
124
c) Compute the distance between the two genes using the formula below:
Total Number of Crossover Types y 100
Linkage value (LV) = Total Number of the Population
d) Make a linkage map indicating the linked genes and the distance between the genes.
Note: 1% LV = 1 map units or centiMorgan (cM)
Transcribed Image Text:Two Linked Genes:
P1
P2
RRSS
Genotype
Phenotype: Red, shrunken kernel
White, Plum kernel
F1
Testcross
Genotype:
Phenotype:
White.shrunken kernel
F2
Red, plum kernel
Red, plump
Red, shrunken 3433
White, plump 3329
White, shrunken 133
118
a) State your hypothesis (
b) Test your hypothesis:
Deviation
Phenotypic
Class
Expected
Frequency (0) Frequency (E)
Observed
D2
X2=D2 /E
(D = 0-E)
1
2
4.
n =
X2com=
State your conclusion:
d) Compute for the linkage value. Show your solution.
e) Make a linkage map.
3.
Expert Solution
This question has been solved!
Explore an expertly crafted, step-by-step solution for a thorough understanding of key concepts.

Step by step
Solved in 3 steps with 3 images

Knowledge Booster


Learn more about
Need a deep-dive on the concept behind this application? Look no further. Learn more about this topic, biology and related others by exploring similar questions and additional content below.Recommended textbooks for you
Human Heredity: Principles and Issues (MindTap Co…
Biology
ISBN:
9781305251052
Author:
Michael Cummings
Publisher:
Cengage Learning
Human Heredity: Principles and Issues (MindTap Co…
Biology
ISBN:
9781305251052
Author:
Michael Cummings
Publisher:
Cengage Learning