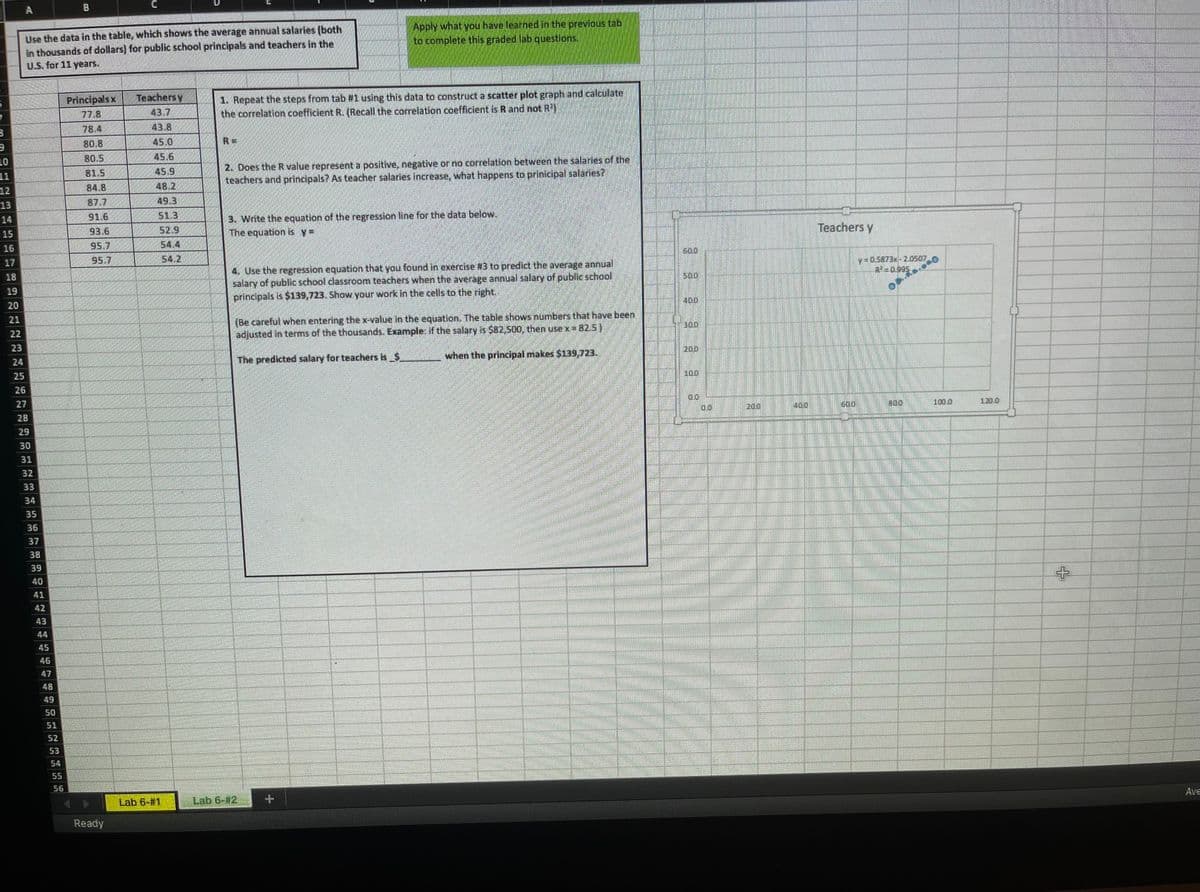
1. Repeat the steps from tab #1 using this data to construct a scatter plot graph and calculate the correlation coefficient R. (Recall the correlation coefficient is R and not R') Principals x Teachers y 77.8 43.7 78.4 43.8 80.8 45.0 R 45.6 2. Does the Rvalue represent a positive, negative or no correlation between the salaries of the teachers and principals? As teacher salaries increase, what happens to prinicipal salaries? 80.5 81.5 45.9 84.8 48.2 87.7 49.3 3. Write the equation of the regression line for the data below. The equation is y= 91.6 51.3 93.6 52.9 95.7 54.4 95.7 54.2 Ilse the regression equation that you found in exercise N3 to predict the average annual


Correlation
Correlation defines a relationship between two independent variables. It tells the degree to which variables move in relation to each other. When two sets of data are related to each other, there is a correlation between them.
Linear Correlation
A correlation is used to determine the relationships between numerical and categorical variables. In other words, it is an indicator of how things are connected to one another. The correlation analysis is the study of how variables are related.
Regression Analysis
Regression analysis is a statistical method in which it estimates the relationship between a dependent variable and one or more independent variable. In simple terms dependent variable is called as outcome variable and independent variable is called as predictors. Regression analysis is one of the methods to find the trends in data. The independent variable used in Regression analysis is named Predictor variable. It offers data of an associated dependent variable regarding a particular outcome.


Trending now
This is a popular solution!

Step by step
Solved in 4 steps with 1 images


