7. A teacher made the following graph showing absences vs. final grades. Absences vs. Final Grade 100 90 80 70 60 50 40 30 20 10 56 7 89 10 Absences Predict the grade of a student that has 7 absences. O A. 50 в. 45 O C. 70 D. 60 Final Grade
7. A teacher made the following graph showing absences vs. final grades. Absences vs. Final Grade 100 90 80 70 60 50 40 30 20 10 56 7 89 10 Absences Predict the grade of a student that has 7 absences. O A. 50 в. 45 O C. 70 D. 60 Final Grade

College Algebra (MindTap Course List)
12th Edition
ISBN:9781305652231
Author:R. David Gustafson, Jeff Hughes
Publisher:R. David Gustafson, Jeff Hughes
Chapter5: Exponential And Logarithmic Functions
Section5.3: Logarithmic Functions And Their Graphs
Problem 137E

Related questions
Question
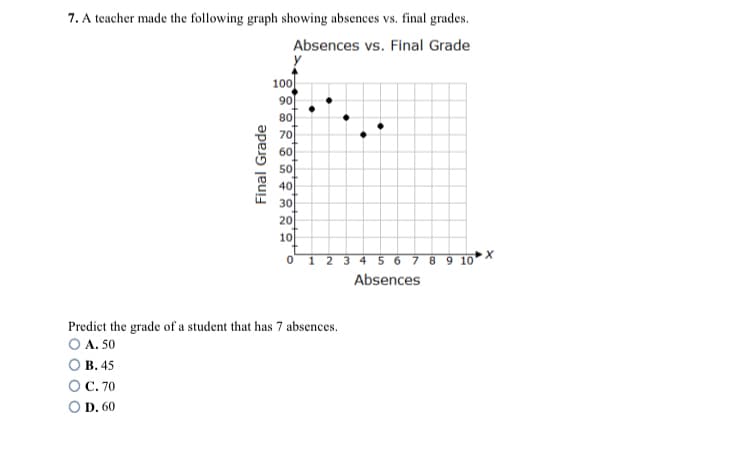
Transcribed Image Text:7. A teacher made the following graph showing absences vs. final grades.
Absences vs. Final Grade
100
90
80
70
60
50
40
30
20
10
1 2 3 4 5 6 7 8 9 10
Absences
Predict the grade of a student that has 7 absences.
O A. 50
В. 45
C. 70
O D. 60
Final Grade
Expert Solution
This question has been solved!
Explore an expertly crafted, step-by-step solution for a thorough understanding of key concepts.

This is a popular solution!

Trending now
This is a popular solution!

Step by step
Solved in 2 steps with 3 images

Knowledge Booster


Learn more about
Need a deep-dive on the concept behind this application? Look no further. Learn more about this topic, statistics and related others by exploring similar questions and additional content below.Recommended textbooks for you
College Algebra (MindTap Course List)
Algebra
ISBN:
9781305652231
Author:
R. David Gustafson, Jeff Hughes
Publisher:
Cengage Learning

Algebra & Trigonometry with Analytic Geometry
Algebra
ISBN:
9781133382119
Author:
Swokowski
Publisher:
Cengage
College Algebra (MindTap Course List)
Algebra
ISBN:
9781305652231
Author:
R. David Gustafson, Jeff Hughes
Publisher:
Cengage Learning
Algebra & Trigonometry with Analytic Geometry
Algebra
ISBN:
9781133382119
Author:
Swokowski
Publisher:
Cengage