1. What percentage of variation in weight is not explained by the regression model? Give your answer correct to 1 decimal place. 2. Use the ANOVA p-value to test the appropriate hypothesis at the 5% level of significance. For each one of the following questions, select the correct answer from the list below. | 15.1 State the decision about Ho v 15.2 State the conclusion about H1 A. Reject the null hypothesis B. Fail to reject the null hypothesis c. There is sufficient evidence for the alternative hypothesis D. There is insufficient evidence for the alternative hypothesis
1. What percentage of variation in weight is not explained by the regression model? Give your answer correct to 1 decimal place. 2. Use the ANOVA p-value to test the appropriate hypothesis at the 5% level of significance. For each one of the following questions, select the correct answer from the list below. | 15.1 State the decision about Ho v 15.2 State the conclusion about H1 A. Reject the null hypothesis B. Fail to reject the null hypothesis c. There is sufficient evidence for the alternative hypothesis D. There is insufficient evidence for the alternative hypothesis

College Algebra
7th Edition
ISBN:9781305115545
Author:James Stewart, Lothar Redlin, Saleem Watson
Publisher:James Stewart, Lothar Redlin, Saleem Watson
Chapter1: Equations And Graphs
Section: Chapter Questions
Problem 10T: Olympic Pole Vault The graph in Figure 7 indicates that in recent years the winning Olympic men’s...

Related questions
Question
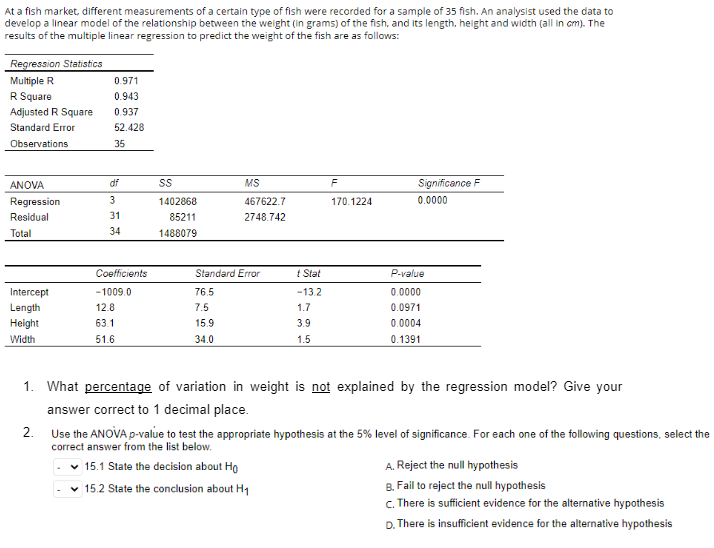
Transcribed Image Text:At a fish market, different measurements of a certain type of fish were recorded for a sample of 35 fish. An analysist used the data to
develop a linear model of the relationship between the weight (in grams) of the fish, and its length, height and width (all in cm). The
results of the multiple linear regression to predict the weight of the fish are as follows:
Regression Statistics
Multiple R
R Square
0.971
0.943
Adjusted R Square
0.937
Standard Error
52.428
Observations
35
df
Significance F
ANOVA
MS
F
Regression
3
1402868
467622.7
170.1224
0.0000
Residual
31
85211
2748.742
Total
34
1488079
Coefficients
Standard Error
t Stat
P-value
-13.2
Intercept
Length
-1009.0
76.5
0.0000
12.8
7.5
1.7
0.0971
Height
63.1
15.9
3.9
0.0004
Width
51.6
34.0
1.5
0.1391
1. What percentage of variation in weight is not explained by the regression model? Give your
answer correct to 1 decimal place.
2. Use the ANOVA p-value to test the appropriate hypothesis at the 5% level of significance. For each one of the following questions, select the
correct answer from the list below.
v 15.1 State the decision about Ho
A. Reject the null hypothesis
15.2 State the conclusion about H1
B. Fail to reject the null hypothesis
c. There is sufficient evidence for the alternative hypothesis
D. There is insufficient evidence for the alternative hypothesis
Expert Solution
This question has been solved!
Explore an expertly crafted, step-by-step solution for a thorough understanding of key concepts.

Step by step
Solved in 3 steps

Recommended textbooks for you
College Algebra
Algebra
ISBN:
9781305115545
Author:
James Stewart, Lothar Redlin, Saleem Watson
Publisher:
Cengage Learning

Algebra & Trigonometry with Analytic Geometry
Algebra
ISBN:
9781133382119
Author:
Swokowski
Publisher:
Cengage

Glencoe Algebra 1, Student Edition, 9780079039897…
Algebra
ISBN:
9780079039897
Author:
Carter
Publisher:
McGraw Hill
College Algebra
Algebra
ISBN:
9781305115545
Author:
James Stewart, Lothar Redlin, Saleem Watson
Publisher:
Cengage Learning
Algebra & Trigonometry with Analytic Geometry
Algebra
ISBN:
9781133382119
Author:
Swokowski
Publisher:
Cengage
Glencoe Algebra 1, Student Edition, 9780079039897…
Algebra
ISBN:
9780079039897
Author:
Carter
Publisher:
McGraw Hill

Algebra and Trigonometry (MindTap Course List)
Algebra
ISBN:
9781305071742
Author:
James Stewart, Lothar Redlin, Saleem Watson
Publisher:
Cengage Learning

Trigonometry (MindTap Course List)
Trigonometry
ISBN:
9781305652224
Author:
Charles P. McKeague, Mark D. Turner
Publisher:
Cengage Learning

Big Ideas Math A Bridge To Success Algebra 1: Stu…
Algebra
ISBN:
9781680331141
Author:
HOUGHTON MIFFLIN HARCOURT
Publisher:
Houghton Mifflin Harcourt