1. Which two variables did you choose? Create a table to summarize the data from the data file. Example below: Example: Listed below are data from a survey conducted recently where Males and Females responded to their happiness with their supervisor (this is fictitious data). Response Male Female Total Not at all 23 25 48 35 Somewhat Very Total 13 22 26 16 42 62 63 125 2. Which hypothesis test is appropriate for this type of data? Explain. What is your null hypothesis? What is your alternative hypothesis? 3. Conduct the hypothesis test. Include any output from Excel. What is your test statistic? Using alpha = 0.05 determine the results of your hypothesis test. Explain. 4. Interpret your results into a conclusion based on your hypothesis (are the variables associated or not?). What are the practical implications of your conclusion? Explain.
1. Which two variables did you choose? Create a table to summarize the data from the data file. Example below: Example: Listed below are data from a survey conducted recently where Males and Females responded to their happiness with their supervisor (this is fictitious data). Response Male Female Total Not at all 23 25 48 35 Somewhat Very Total 13 22 26 16 42 62 63 125 2. Which hypothesis test is appropriate for this type of data? Explain. What is your null hypothesis? What is your alternative hypothesis? 3. Conduct the hypothesis test. Include any output from Excel. What is your test statistic? Using alpha = 0.05 determine the results of your hypothesis test. Explain. 4. Interpret your results into a conclusion based on your hypothesis (are the variables associated or not?). What are the practical implications of your conclusion? Explain.

Big Ideas Math A Bridge To Success Algebra 1: Student Edition 2015
1st Edition
ISBN:9781680331141
Author:HOUGHTON MIFFLIN HARCOURT
Publisher:HOUGHTON MIFFLIN HARCOURT
Chapter4: Writing Linear Equations
Section4.5: Analyzing Lines Of Fit
Problem 31E

Related questions
Question
Transcribed Image Text:Customer
Bill
Tip Tip_Rate%
Size Smoking
Time
32.76
3.70
11.3
3
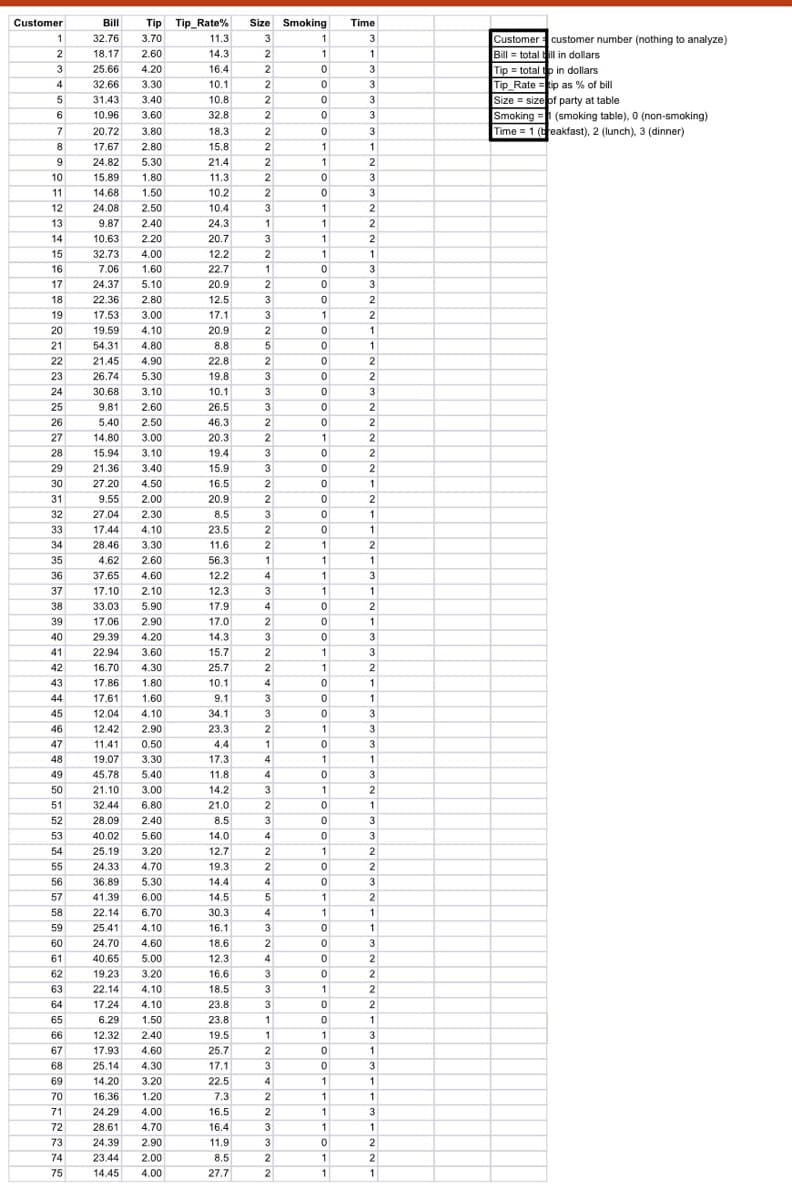
Customer customer number (nothing to analyze)
Bill = total ill in dollars
Tip = total to in dollars
Tip_Rate =tip as % of bill
Size = size of party at table
Smoking = (smoking table), 0 (non-smoking)
Time = 1 (treakfast), 2 (lunch), 3 (dinner)
1
3
2
18.17
2.60
14.3
2
1
3
25.66
4.20
16.4
4.
32.66
3.30
10.1
2
3
24 42
31.43
3.40
5
10.8
3
6
10.96
3.60
32.8
3
7
20.72
3.80
18.3
2
3
8
17.67
2.80
15.8
2
1
1
24.82
5.30
21.4
2
10
15.89
1.80
11.3
2
11
14.68
1.50
10.2
2
3
12
24.08
2.50
10.4
3
2
13
9.87
2.40
24.3
1
2
14
10.63
2.20
20.7
3
1
15
32.73
4.00
12.2
2
1
16
7.06
1.60
22.7
1
17
24.37
5.10
20.9
3
18
22.36
2.80
12.5
19
17.53
3.00
17.1
3
2
20
19.59
4.10
20.9
2
1
21
54.31
4.80
8.8
5
1
22
21.45
4.90
22.8
2
2
23
26.74
5.30
19.8
3
2
24
30.68
3.10
10.1
3
3
25
9.81
2.60
26.5
3
2
26
5.40
2.50
46.3
2
2
27
14.80
3.00
20.3
2
2
28
15.94
3.10
19.4
3
29
21.36
3.40
15.9
3
2
30
27.20
4.50
16.5
2
1
31
9.55
2.00
20.9
2
27.04
17.44
32
2.30
8.5
3
1
33
4.10
23.5
1
34
28.46
3.30
11.6
1
2
35
4.62
2.60
56.3
1
1
36
37.65
4.60
12.2
4
3
37
17.10
2.10
12.3
3
1
1
38
33.03
5.90
17.9
4
39
17.06
2.90
17.0
1
40
29.39
4.20
14.3
3
3
41
22.94
3.60
15.7
1
3
42
16.70
4.30
25.7
2
1
43
17.86
1.80
10.1
4
1
44
17.61
1.60
9.1
3
1
45
12.04
4.10
34.1
3
3
46
12.42
2.90
23.3
2
3
47
11.41
0.50
4.4
3
48
19.07
3.30
5 40
17.3
4
1
49
45.78
5.40
11.8
4
3
50
21.10
3.00
14.2
3
2
51
32.44
6.80
21.0
1
52
28.09
2.40
8.5
3
3
53
40.02
5.60
14.0
4
3
54
25.19
3.20
12.7
2
2
55
24.33
4.70
19.3
2
56
36.89
5.30
14.4
4
3
57
41.39
6.00
14.5
5
2
58
22.14
6.70
30.3
4
1
1
59
25.41
4.10
16.1
3
1
60
24.70
4.60
18.6
2
3
61
40.65
5.00
12.3
2
62
19.23
3.20
16.6
63
22.14
4.10
18.5
3
1
2
64
17.24
4.10
23.8
3
2
65
6.29
1.50
23.8
1
1
66
12.32
2.40
19.5
1
1
67
17.93
4.60
25.7
2
68
25.14
4.30
17.1
3
3
69
14.20
3.20
22.5
1
70
16.36
1.20
7.3
2
1
71
24.29
4.00
16.5
2
1
3
72
28.61
4.70
16.4
3
1
1
73
24.39
2.90
11.9
3
2
74
23.44
2.00
8.5
2
2
75
14.45
4.00
27.7
2
1
1
Transcribed Image Text:Assignment #6
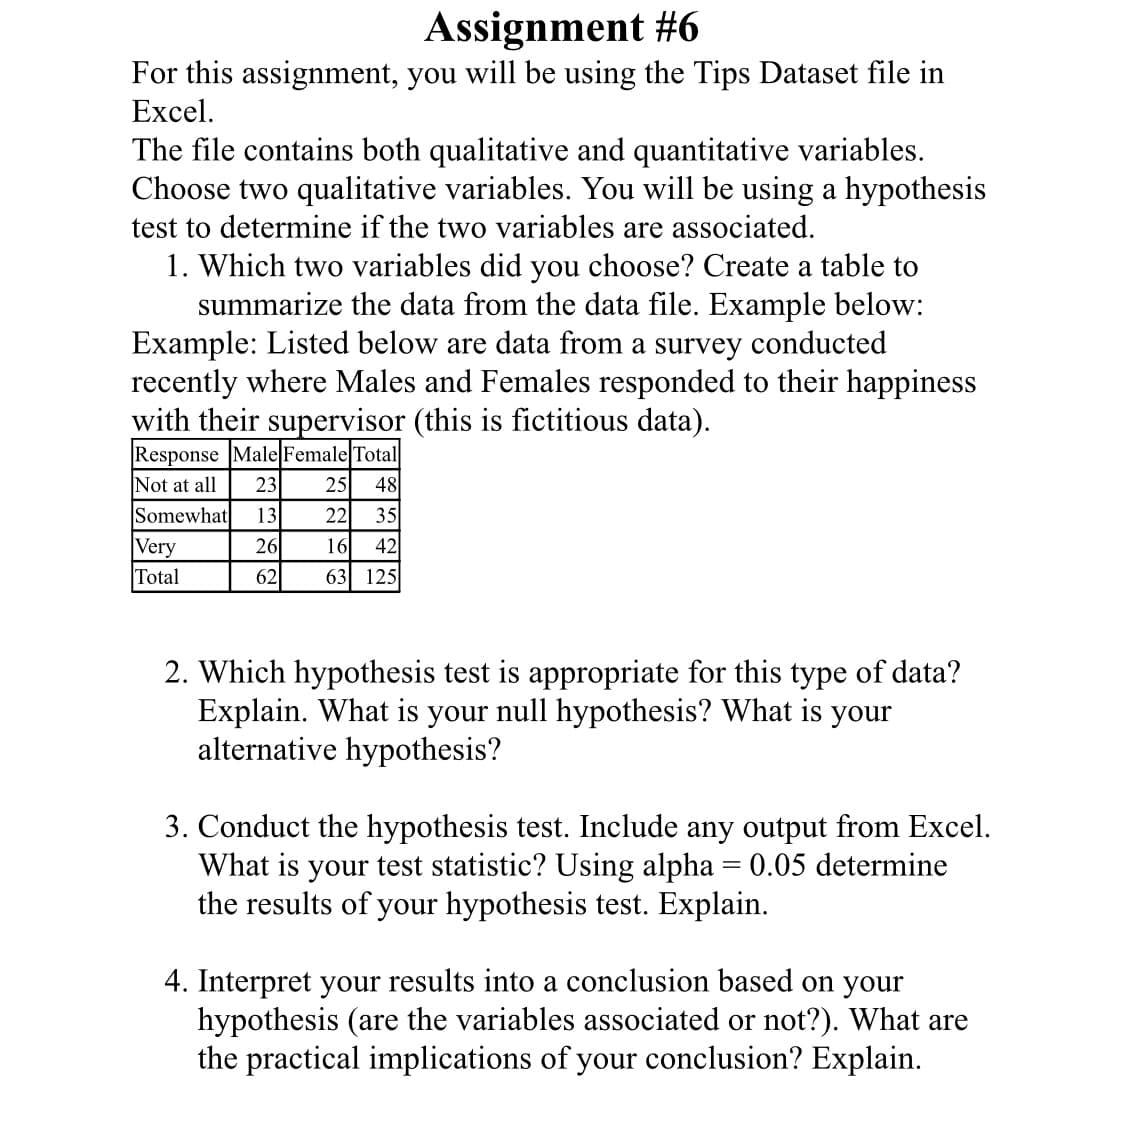
For this assignment, you will be using the Tips Dataset file in
Excel.
The file contains both qualitative and quantitative variables.
Choose two qualitative variables. You will be using a hypothesis
test to determine if the two variables are associated.
1. Which two variables did you choose? Create a table to
summarize the data from the data file. Example below:
Example: Listed below are data from a survey conducted
recently where Males and Females responded to their happiness
with their supervisor (this is fictitious data).
Response Male Female Total
Not at all
23
25
48
Somewhat
13
22
35
Very
Total
26
16
42
62
63 125
2. Which hypothesis test is appropriate for this type of data?
Explain. What is your null hypothesis? What is your
alternative hypothesis?
3. Conduct the hypothesis test. Include any output from Excel.
What is your test statistic? Using alpha = 0.05 determine
the results of your hypothesis test. Explain.
4. Interpret your results into a conclusion based on your
hypothesis (are the variables associated or not?). What are
the practical implications of your conclusion? Explain.
Expert Solution
This question has been solved!
Explore an expertly crafted, step-by-step solution for a thorough understanding of key concepts.

This is a popular solution!

Trending now
This is a popular solution!

Step by step
Solved in 6 steps

Knowledge Booster


Learn more about
Need a deep-dive on the concept behind this application? Look no further. Learn more about this topic, statistics and related others by exploring similar questions and additional content below.Recommended textbooks for you
Big Ideas Math A Bridge To Success Algebra 1: Stu…
Algebra
ISBN:
9781680331141
Author:
HOUGHTON MIFFLIN HARCOURT
Publisher:
Houghton Mifflin Harcourt

Functions and Change: A Modeling Approach to Coll…
Algebra
ISBN:
9781337111348
Author:
Bruce Crauder, Benny Evans, Alan Noell
Publisher:
Cengage Learning

Glencoe Algebra 1, Student Edition, 9780079039897…
Algebra
ISBN:
9780079039897
Author:
Carter
Publisher:
McGraw Hill
Big Ideas Math A Bridge To Success Algebra 1: Stu…
Algebra
ISBN:
9781680331141
Author:
HOUGHTON MIFFLIN HARCOURT
Publisher:
Houghton Mifflin Harcourt
Functions and Change: A Modeling Approach to Coll…
Algebra
ISBN:
9781337111348
Author:
Bruce Crauder, Benny Evans, Alan Noell
Publisher:
Cengage Learning
Glencoe Algebra 1, Student Edition, 9780079039897…
Algebra
ISBN:
9780079039897
Author:
Carter
Publisher:
McGraw Hill

Holt Mcdougal Larson Pre-algebra: Student Edition…
Algebra
ISBN:
9780547587776
Author:
HOLT MCDOUGAL
Publisher:
HOLT MCDOUGAL