10+ 8+ 7 13 19 25 31 37 data Based on the histogram above, what is the class width? Class width: !! What is the sample size? Sampl 2.
10+ 8+ 7 13 19 25 31 37 data Based on the histogram above, what is the class width? Class width: !! What is the sample size? Sampl 2.

College Algebra (MindTap Course List)
12th Edition
ISBN:9781305652231
Author:R. David Gustafson, Jeff Hughes
Publisher:R. David Gustafson, Jeff Hughes
Chapter8: Sequences, Series, And Probability
Section8.7: Probability
Problem 58E: What is meant by the sample space of an experiment?

Related questions
Question
9
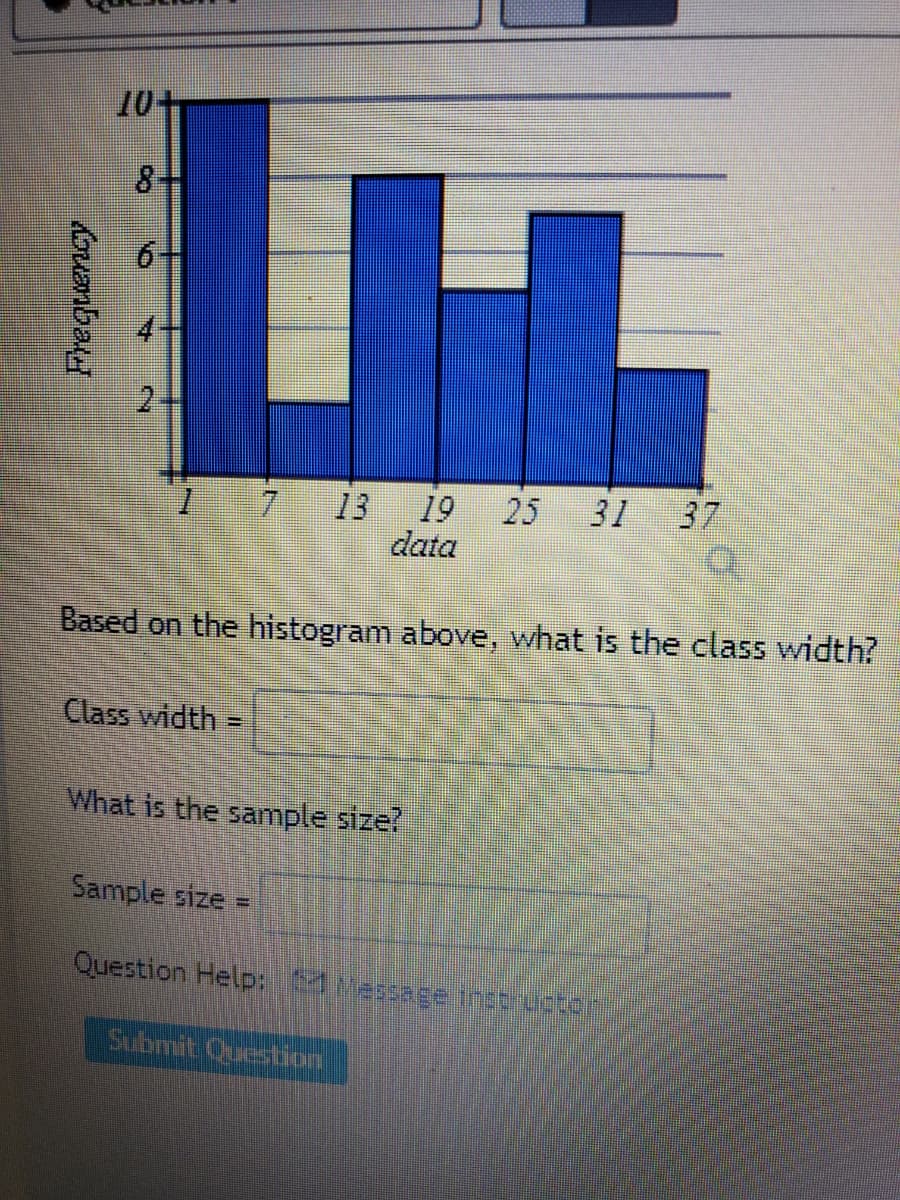
Transcribed Image Text:10+
2.
7
13
19
25
31
37
data
Based on the histogram above, what is the class width?
Class width =
%3D
What is the sample size?
Sample size =
Question Help: Massaee instrurter
Submit Question
Expert Solution
This question has been solved!
Explore an expertly crafted, step-by-step solution for a thorough understanding of key concepts.

This is a popular solution!

Trending now
This is a popular solution!

Step by step
Solved in 2 steps with 2 images

Recommended textbooks for you
College Algebra (MindTap Course List)
Algebra
ISBN:
9781305652231
Author:
R. David Gustafson, Jeff Hughes
Publisher:
Cengage Learning
College Algebra (MindTap Course List)
Algebra
ISBN:
9781305652231
Author:
R. David Gustafson, Jeff Hughes
Publisher:
Cengage Learning