14- 13 Titration of weak acid CH,COOH 12 Equivalence point pH, 8.72 10 Phenolphthalein [pH range Equivalence point pH, 7.00 Litmus pH range 6. Methyl orange [pH range 4 3 Titration of strong acid HCI 1 - 10 15 20 25 30 35 40 45 50 Volume of 0.100 M NaOH added (mL) Figure 14.23 The graph shows a titration curve for the titration of 25.00 mL of 0.100 M CH3CO,H (weak acid) with 0.100 M NaOH (strong base) and the titration curve for the titration of HCI (strong acid) with NaOH (strong base). The pH ranges for the color change of phenolphthalein, litmus, and methyl orange are indicated by the shaded areas. 11 Hd
14- 13 Titration of weak acid CH,COOH 12 Equivalence point pH, 8.72 10 Phenolphthalein [pH range Equivalence point pH, 7.00 Litmus pH range 6. Methyl orange [pH range 4 3 Titration of strong acid HCI 1 - 10 15 20 25 30 35 40 45 50 Volume of 0.100 M NaOH added (mL) Figure 14.23 The graph shows a titration curve for the titration of 25.00 mL of 0.100 M CH3CO,H (weak acid) with 0.100 M NaOH (strong base) and the titration curve for the titration of HCI (strong acid) with NaOH (strong base). The pH ranges for the color change of phenolphthalein, litmus, and methyl orange are indicated by the shaded areas. 11 Hd

Chemistry: Principles and Practice
3rd Edition
ISBN:9780534420123
Author:Daniel L. Reger, Scott R. Goode, David W. Ball, Edward Mercer
Publisher:Daniel L. Reger, Scott R. Goode, David W. Ball, Edward Mercer
Chapter16: Reactions Between Acids And Bases
Section: Chapter Questions
Problem 16.58QE

Related questions

Question
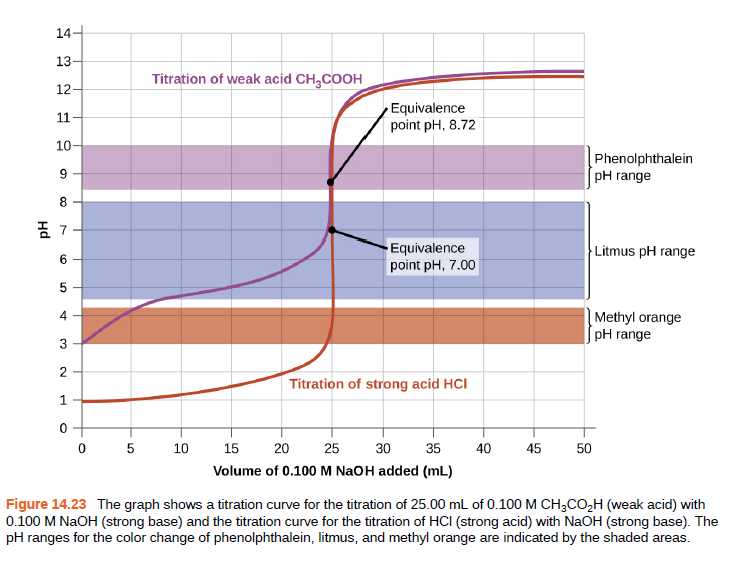
The titration curve as shown is for the titration of 25.00 mL of 0.100 M CH3CO2H with 0.100 M NaOH. The reaction can be represented as:
CH3 CO2 H + OH− ⟶ CH3 CO2− + H2 O
(a) What is the initial pH before any amount of the NaOH solution has been added? Ka = 1.8 × 10⁻⁵ for CH3CO2H.
(b) Find the pH after 25.00 mL of the NaOH solution have been added.
(c) Find the pH after 12.50 mL of the NaOH solution has been added.
(d) Find the pH after 37.50 mL of the NaOH solution has been added.
Transcribed Image Text:14-
13
Titration of weak acid CH,COOH
12
Equivalence
point pH, 8.72
10
Phenolphthalein
[pH range
Equivalence
point pH, 7.00
Litmus pH range
6.
Methyl orange
[pH range
4
3
Titration of strong acid HCI
1 -
10
15
20
25
30
35
40
45
50
Volume of 0.100 M NaOH added (mL)
Figure 14.23 The graph shows a titration curve for the titration of 25.00 mL of 0.100 M CH3CO,H (weak acid) with
0.100 M NaOH (strong base) and the titration curve for the titration of HCI (strong acid) with NaOH (strong base). The
pH ranges for the color change of phenolphthalein, litmus, and methyl orange are indicated by the shaded areas.
11
Hd
Expert Solution


Trending now
This is a popular solution!

Step by step
Solved in 9 steps

Knowledge Booster


Learn more about
Need a deep-dive on the concept behind this application? Look no further. Learn more about this topic, chemistry and related others by exploring similar questions and additional content below.Recommended textbooks for you
Chemistry: Principles and Practice
Chemistry
ISBN:
9780534420123
Author:
Daniel L. Reger, Scott R. Goode, David W. Ball, Edward Mercer
Publisher:
Cengage Learning

Chemistry: An Atoms First Approach
Chemistry
ISBN:
9781305079243
Author:
Steven S. Zumdahl, Susan A. Zumdahl
Publisher:
Cengage Learning

Chemistry: Principles and Practice
Chemistry
ISBN:
9780534420123
Author:
Daniel L. Reger, Scott R. Goode, David W. Ball, Edward Mercer
Publisher:
Cengage Learning
Chemistry: An Atoms First Approach
Chemistry
ISBN:
9781305079243
Author:
Steven S. Zumdahl, Susan A. Zumdahl
Publisher:
Cengage Learning

Chemistry
Chemistry
ISBN:
9781305957404
Author:
Steven S. Zumdahl, Susan A. Zumdahl, Donald J. DeCoste
Publisher:
Cengage Learning


Principles of Modern Chemistry
Chemistry
ISBN:
9781305079113
Author:
David W. Oxtoby, H. Pat Gillis, Laurie J. Butler
Publisher:
Cengage Learning