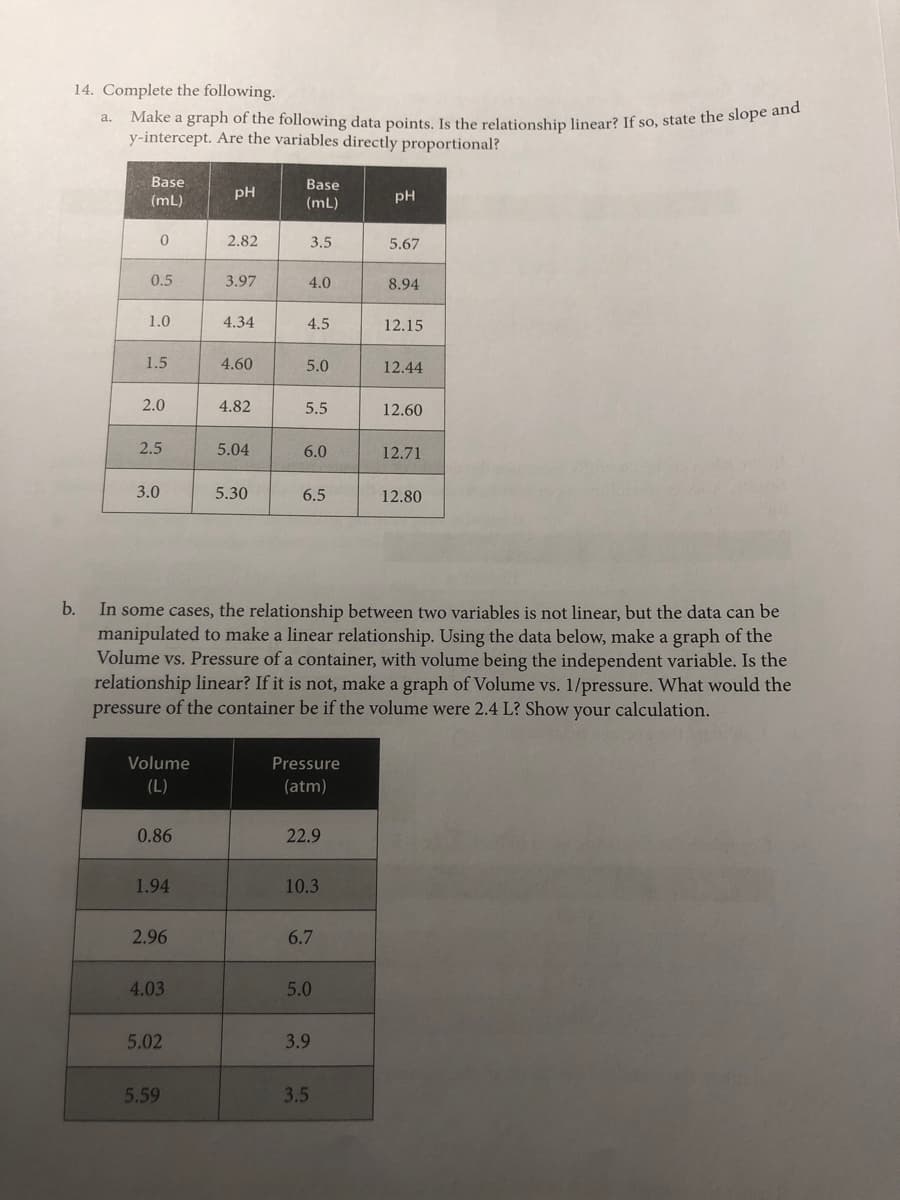
14. Complete the following. a. Make a graph of the following data points. Is the relationship linear? If so, state the slope ume y-intercept. Are the variables directly proportional? Base Base pH pH (mL) (mL) 2.82 3.5 5.67 0.5 3.97 4.0 8.94 1.0 4.34 4.5 12.15 1.5 4.60 5.0 12.44 2.0 4.82 5.5 12.60 2.5 5.04 6.0 12.71 3.0 5.30 6.5 12.80 In some cases, the relationship between two variables is not linear, but the data can be manipulated to make a linear relationship. Using the data below, make a graph of the Volume vs. Pressure of a container, with volume being the independent variable. Is the relationship linear? If it is not, make a graph of Volume vs. 1/pressure. What would the pressure of the container be if the volume were 2.4 L? Show your calculation. Volume Pressure (L) (atm) 0.86 22.9 1.94 10.3 2.96 6.7 4.03 5.0 5.02 3.9 5.59 3.5
14. Complete the following. a. Make a graph of the following data points. Is the relationship linear? If so, state the slope ume y-intercept. Are the variables directly proportional? Base Base pH pH (mL) (mL) 2.82 3.5 5.67 0.5 3.97 4.0 8.94 1.0 4.34 4.5 12.15 1.5 4.60 5.0 12.44 2.0 4.82 5.5 12.60 2.5 5.04 6.0 12.71 3.0 5.30 6.5 12.80 In some cases, the relationship between two variables is not linear, but the data can be manipulated to make a linear relationship. Using the data below, make a graph of the Volume vs. Pressure of a container, with volume being the independent variable. Is the relationship linear? If it is not, make a graph of Volume vs. 1/pressure. What would the pressure of the container be if the volume were 2.4 L? Show your calculation. Volume Pressure (L) (atm) 0.86 22.9 1.94 10.3 2.96 6.7 4.03 5.0 5.02 3.9 5.59 3.5

Chapter4: Least-squares And Calibration Methods
Section: Chapter Questions
Problem 1P

Related questions
Question
Transcribed Image Text:14. Complete the following.
a. Make a graph of the following data points. Is the relationship linear? If so, state the slope ume
y-intercept. Are the variables directly proportional?
Base
Base
pH
pH
(mL)
(mL)
2.82
3.5
5.67
0.5
3.97
4.0
8.94
1.0
4.34
4.5
12.15
1.5
4.60
5.0
12.44
2.0
4.82
5.5
12.60
2.5
5.04
6.0
12.71
3.0
5.30
6.5
12.80
In some cases, the relationship between two variables is not linear, but the data can be
manipulated to make a linear relationship. Using the data below, make a graph of the
Volume vs. Pressure of a container, with volume being the independent variable. Is the
relationship linear? If it is not, make a graph of Volume vs. 1/pressure. What would the
pressure of the container be if the volume were 2.4 L? Show your calculation.
Volume
Pressure
(L)
(atm)
0.86
22.9
1.94
10.3
2.96
6.7
4.03
5.0
5.02
3.9
5.59
3.5
Expert Solution
This question has been solved!
Explore an expertly crafted, step-by-step solution for a thorough understanding of key concepts.

This is a popular solution!

Trending now
This is a popular solution!

Step by step
Solved in 7 steps with 8 images

Knowledge Booster


Learn more about
Need a deep-dive on the concept behind this application? Look no further. Learn more about this topic, chemistry and related others by exploring similar questions and additional content below.Recommended textbooks for you