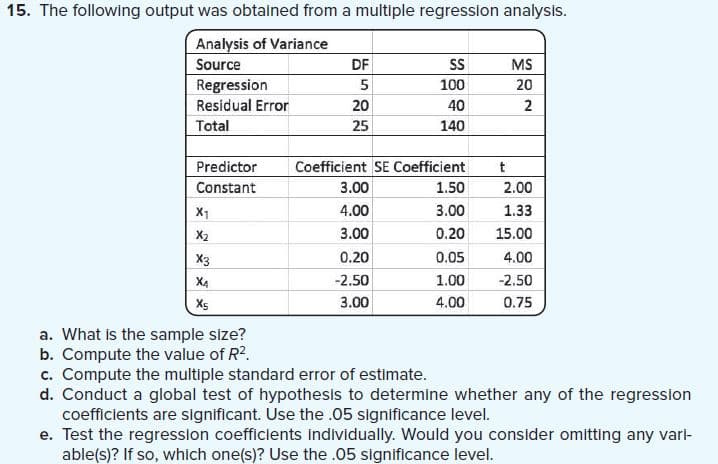
15. The following output was obtained from a multiple regression analysls. Analysis of Variance Source DF SS MS Regression Residual Error 100 20 20 40 2 Total 25 140 Predictor Coefficient SE Coefficient t Constant 3.00 1.50 2.00 X1 4.00 3.00 1.33 X2 3.00 0.20 15.00 X3 0.20 0.05 4.00 X4 -2.50 1.00 -2.50 Xs 3.00 4.00 0.75 a. What is the sample size? b. Compute the value of R2. c. Compute the multiple standard error of estimate. d. Conduct a global test of hypothesis to determine whether any of the regression coefficlents are significant. Use the .05 significance level. e. Test the regresslon coefficients individually. Would you consider omitting any varl- able(s)? If so, which one(s)? Use the .05 significance level.

MATLAB: An Introduction with Applications
6th Edition
ISBN:9781119256830
Author:Amos Gilat
Publisher:Amos Gilat
Chapter1: Starting With Matlab
Section: Chapter Questions
Problem 1P
icon
Related questions
icon
Concept explainers
Question
15. The following output was obtained from a multiple regression analysis.
Analysis of Variance
DF
Source
S
MS
Regression
Residual Error
5
100
20
20
40
2
Total
25
140
Predictor
Coefficient SE Coefficient
t
Constant
3.00
1.50
2.00
X1
4.00
3.00
1.33
X2
3.00
0.20
15.00
X3
0.20
0.05
4.00
X4
-2.50
1.00
-2.50
Xs
3.00
4.00
0.75
a. What is the sample size?
b. Compute the value of R2.
c. Compute the multiple standard error of estimate.
d. Conduct a global test of hypothesis to determine whether any of the regression
coefficients are significant. Use the .05 significance level.
e. Test the regression coefficients individually. Would you consider omitting any vari-
able(s)? If so, which one(s)? Use the .05 significance level.
Transcribed Image Text:15. The following output was obtained from a multiple regression analysis. Analysis of Variance DF Source S MS Regression Residual Error 5 100 20 20 40 2 Total 25 140 Predictor Coefficient SE Coefficient t Constant 3.00 1.50 2.00 X1 4.00 3.00 1.33 X2 3.00 0.20 15.00 X3 0.20 0.05 4.00 X4 -2.50 1.00 -2.50 Xs 3.00 4.00 0.75 a. What is the sample size? b. Compute the value of R2. c. Compute the multiple standard error of estimate. d. Conduct a global test of hypothesis to determine whether any of the regression coefficients are significant. Use the .05 significance level. e. Test the regression coefficients individually. Would you consider omitting any vari- able(s)? If so, which one(s)? Use the .05 significance level.
Expert Solution
trending now

Trending now

This is a popular solution!

steps

Step by step

Solved in 3 steps

Blurred answer
Knowledge Booster
Correlation, Regression, and Association
Learn more about
Need a deep-dive on the concept behind this application? Look no further. Learn more about this topic, statistics and related others by exploring similar questions and additional content below.
Similar questions
  • SEE MORE QUESTIONS
Recommended textbooks for you
MATLAB: An Introduction with Applications
Statistics
ISBN:
9781119256830
Author:
Amos Gilat
Publisher:
John Wiley & Sons Inc
Probability and Statistics for Engineering and th…
Statistics
ISBN:
9781305251809
Author:
Jay L. Devore
Publisher:
Cengage Learning
Statistics for The Behavioral Sciences (MindTap C…
Statistics
ISBN:
9781305504912
Author:
Frederick J Gravetter, Larry B. Wallnau
Publisher:
Cengage Learning
Elementary Statistics: Picturing the World (7th E…
Statistics
ISBN:
9780134683416
Author:
Ron Larson, Betsy Farber
Publisher:
PEARSON
The Basic Practice of Statistics
Statistics
ISBN:
9781319042578
Author:
David S. Moore, William I. Notz, Michael A. Fligner
Publisher:
W. H. Freeman
Introduction to the Practice of Statistics
Statistics
ISBN:
9781319013387
Author:
David S. Moore, George P. McCabe, Bruce A. Craig
Publisher:
W. H. Freeman