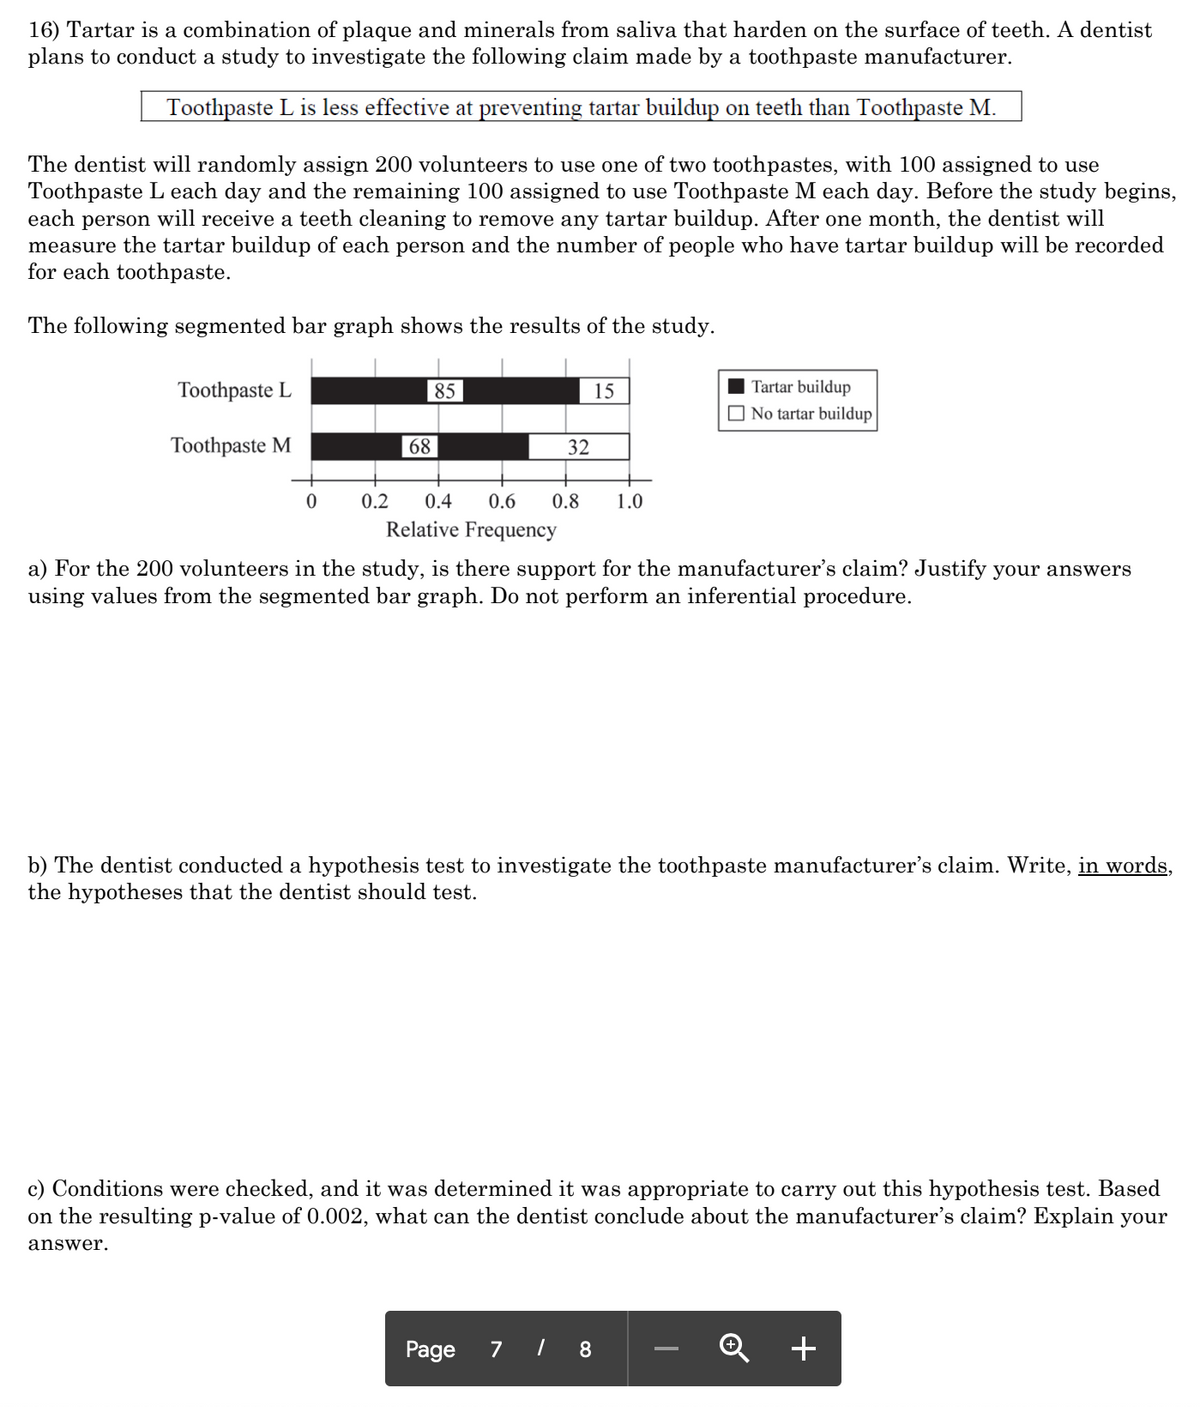
16) Tartar is a combination of plaque and minerals from saliva that harden on the surface of teeth. A dentist plans to conduct a study to investigate the following claim made by a toothpaste manufacturer. Toothpaste L is less effective at preventing tartar buildup on teeth than Toothpaste M. The dentist will randomly assign 200 volunteers to use one of two toothpastes, with 100 assigned to use Toothpaste L each day and the remaining 100 assigned to use Toothpaste M each day. Before the study begins, each person will receive a teeth cleaning to remove any tartar buildup. After one month, the dentist will measure the tartar buildup of each person and the number of people who have tartar buildup will be recorded for each toothpaste. The following segmented bar graph shows the results of the study. Toothpaste L |85 15 Tartar buildup O No tartar buildup Toothpaste M 68 32 0.2 0.4 0.6 0.8 1.0 Relative Frequency a) For the 200 volunteers in the study, is there support for the manufacturer's claim? Justify your answers using values from the segmented bar graph. Do not perform an inferential procedure. b) The dentist conducted a hypothesis test to investigate the toothpaste manufacturer's claim. Write, in words, the hypotheses that the dentist should test. c) Conditions were checked, and it was determined it was appropriate to carry out this hypothesis test. Based on the resulting p-value of 0.002, what can the dentist conclude about the manufacturer's claim? Explain your answer.
16) Tartar is a combination of plaque and minerals from saliva that harden on the surface of teeth. A dentist plans to conduct a study to investigate the following claim made by a toothpaste manufacturer. Toothpaste L is less effective at preventing tartar buildup on teeth than Toothpaste M. The dentist will randomly assign 200 volunteers to use one of two toothpastes, with 100 assigned to use Toothpaste L each day and the remaining 100 assigned to use Toothpaste M each day. Before the study begins, each person will receive a teeth cleaning to remove any tartar buildup. After one month, the dentist will measure the tartar buildup of each person and the number of people who have tartar buildup will be recorded for each toothpaste. The following segmented bar graph shows the results of the study. Toothpaste L |85 15 Tartar buildup O No tartar buildup Toothpaste M 68 32 0.2 0.4 0.6 0.8 1.0 Relative Frequency a) For the 200 volunteers in the study, is there support for the manufacturer's claim? Justify your answers using values from the segmented bar graph. Do not perform an inferential procedure. b) The dentist conducted a hypothesis test to investigate the toothpaste manufacturer's claim. Write, in words, the hypotheses that the dentist should test. c) Conditions were checked, and it was determined it was appropriate to carry out this hypothesis test. Based on the resulting p-value of 0.002, what can the dentist conclude about the manufacturer's claim? Explain your answer.

Glencoe Algebra 1, Student Edition, 9780079039897, 0079039898, 2018
18th Edition
ISBN:9780079039897
Author:Carter
Publisher:Carter
Chapter10: Statistics
Section10.6: Summarizing Categorical Data
Problem 28PPS

Related questions

Topic Video
Question
Transcribed Image Text:16) Tartar is a combination of plaque and minerals from saliva that harden on the surface of teeth. A dentist
plans to conduct a study to investigate the following claim made by a toothpaste manufacturer.
Toothpaste L is less effective at preventing tartar buildup on teeth than Toothpaste M.
The dentist will randomly assign 200 volunteers to use one of two toothpastes, with 100 assigned to use
Toothpaste L each day and the remaining 100 assigned to use Toothpaste M each day. Before the study begins,
each person will receive a teeth cleaning to remove any tartar buildup. After one month, the dentist will
measure the tartar buildup of each person and the number of people who have tartar buildup will be recorded
for each toothpaste.
The following segmented bar graph shows the results of the study.
Toothpaste L
85
15
Tartar buildup
O No tartar buildup
Toothpaste M
68
32
0.2
0.4
0.6
0.8
1.0
Relative Frequency
a) For the 200 volunteers in the study, is there support for the manufacturer's claim? Justify your answers
using values from the segmented bar graph. Do not perform an inferential procedure.
b) The dentist conducted a hypothesis test to investigate the toothpaste manufacturer's claim. Write, in words,
the hypotheses that the dentist should test.
c) Conditions were checked, and it was determined it was appropriate to carry out this hypothesis test. Based
on the resulting p-value of 0.002, what can the dentist conclude about the manufacturer's claim? Explain your
answer.
Page 7 1 8
+
Expert Solution
This question has been solved!
Explore an expertly crafted, step-by-step solution for a thorough understanding of key concepts.

This is a popular solution!

Trending now
This is a popular solution!

Step by step
Solved in 2 steps

Knowledge Booster


Learn more about
Need a deep-dive on the concept behind this application? Look no further. Learn more about this topic, statistics and related others by exploring similar questions and additional content below.Recommended textbooks for you
Glencoe Algebra 1, Student Edition, 9780079039897…
Algebra
ISBN:
9780079039897
Author:
Carter
Publisher:
McGraw Hill
Glencoe Algebra 1, Student Edition, 9780079039897…
Algebra
ISBN:
9780079039897
Author:
Carter
Publisher:
McGraw Hill