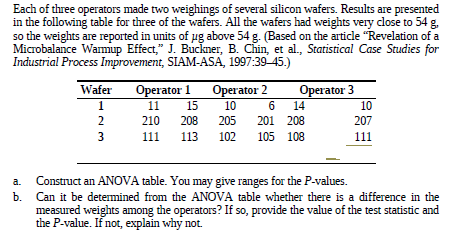
Each of three operators made two weighings of several silicon wafers. Results are presented in the following table for three of the wafers. All the wafers had weights very close to 54 g. so the weights are reported in units of ug above 54 g. (Based on the article "Revelation of a Microbalance Warmup Effect," J. Buckner, B. Chin, et al., Statistical Case Studies for Industrial Process Improvement, SIAM-ASA, 1997:39 45.) Operator 1 Operator 2 15 10 Operator 3 14 Wafer 11 10 2 210 208 205 201 208 207 111 113 102 105 108 111 Construct an ANOVA table. You may give ranges for the P-values. b. Can it be determined from the ANOVA table whether there is a difference in the measured weights among the operators? If so, provide the value of the test statistic and the P-value. If not, explain why not. 3.
Each of three operators made two weighings of several silicon wafers. Results are presented in the following table for three of the wafers. All the wafers had weights very close to 54 g. so the weights are reported in units of ug above 54 g. (Based on the article "Revelation of a Microbalance Warmup Effect," J. Buckner, B. Chin, et al., Statistical Case Studies for Industrial Process Improvement, SIAM-ASA, 1997:39 45.) Operator 1 Operator 2 15 10 Operator 3 14 Wafer 11 10 2 210 208 205 201 208 207 111 113 102 105 108 111 Construct an ANOVA table. You may give ranges for the P-values. b. Can it be determined from the ANOVA table whether there is a difference in the measured weights among the operators? If so, provide the value of the test statistic and the P-value. If not, explain why not. 3.

Holt Mcdougal Larson Pre-algebra: Student Edition 2012
1st Edition
ISBN:9780547587776
Author:HOLT MCDOUGAL
Publisher:HOLT MCDOUGAL
Chapter11: Data Analysis And Probability
Section: Chapter Questions
Problem 8CR

Related questions
Question
Transcribed Image Text:Each of three operators made two weighings of several silicon wafers. Results are presented
in the following table for three of the wafers. All the wafers had weights very close to 54 g.
so the weights are reported in units of ug above 54 g. (Based on the article "Revelation of a
Microbalance Warmup Effect," J. Buckner, B. Chin, et al., Statistical Case Studies for
Industrial Process Improvement, SIAM-ASA, 1997:39 45.)
Operator 1
Operator 2
15
10
Operator 3
14
Wafer
11
10
2
210
208
205
201 208
207
111
113
102
105 108
111
Construct an ANOVA table. You may give ranges for the P-values.
b. Can it be determined from the ANOVA table whether there is a difference in the
measured weights among the operators? If so, provide the value of the test statistic and
the P-value. If not, explain why not.
3.
Expert Solution
This question has been solved!
Explore an expertly crafted, step-by-step solution for a thorough understanding of key concepts.

This is a popular solution!

Trending now
This is a popular solution!

Step by step
Solved in 2 steps with 2 images

Recommended textbooks for you
Holt Mcdougal Larson Pre-algebra: Student Edition…
Algebra
ISBN:
9780547587776
Author:
HOLT MCDOUGAL
Publisher:
HOLT MCDOUGAL

Algebra & Trigonometry with Analytic Geometry
Algebra
ISBN:
9781133382119
Author:
Swokowski
Publisher:
Cengage

Glencoe Algebra 1, Student Edition, 9780079039897…
Algebra
ISBN:
9780079039897
Author:
Carter
Publisher:
McGraw Hill
Holt Mcdougal Larson Pre-algebra: Student Edition…
Algebra
ISBN:
9780547587776
Author:
HOLT MCDOUGAL
Publisher:
HOLT MCDOUGAL
Algebra & Trigonometry with Analytic Geometry
Algebra
ISBN:
9781133382119
Author:
Swokowski
Publisher:
Cengage
Glencoe Algebra 1, Student Edition, 9780079039897…
Algebra
ISBN:
9780079039897
Author:
Carter
Publisher:
McGraw Hill